
Figures & data
Table 1. Overview of empirical studies on the effect of the form of instruction and disability on assembly performance (n/a = significance not assessed, * = significant difference, otherwise non-significant difference).
Figure 1. Forms of instruction studied with the elements inside a box.
At heart of the figure is paper instructions’ element box including text and image. Animations add GIFs, annotations, and next step. Projection adds guide light. Adaptive projection shows or hides these elements based on the experience level.
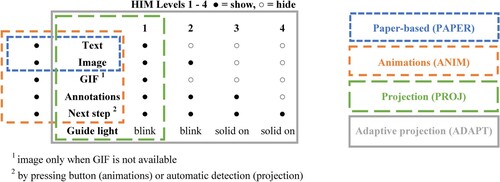
Figure 2. Example of operator experience level (adaptivity of instructions) based on algorithm.
In this scatter chart, each point represents step group cycle time from cycle 1 to 33. A trend line illustrates how operator’s experience level improves from level 1 to 3 through cycles.
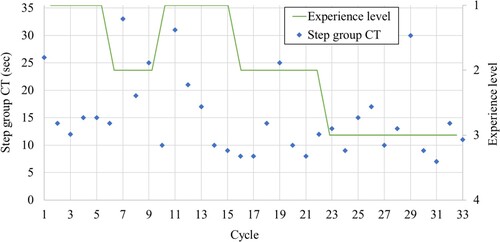
Figure 3. Effect of form of instruction on mean and SD (2σ) of CT in each cycle.
Paper instructions and animations result in longer first cycle time and steeper initial learning curve. Each curve levels out until cycle 15. With paper instructions, within-group variance is very high in the first cycle and with adaptive projection later.
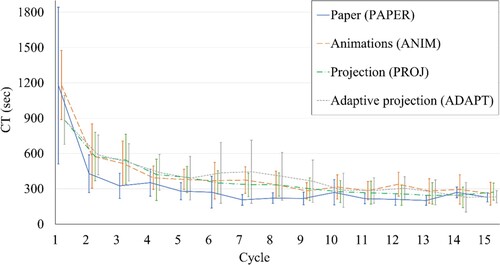
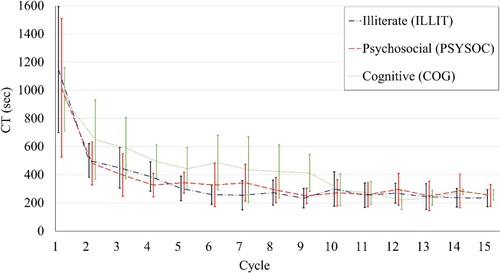
Figure 4. Effect of type of disability on mean and SD (2σ) of CT in each cycle.
Illiterate has longest first cycle time. Illiterate and psychosocially disabled people have steeper initial learning curve. Cognitively disabled people learn much slower, and their cycle times show high variation. Each curve levels out until cycle 15.
Data availability statement
The data that supports the findings of this study is available from the corresponding author upon reasonable request.