
Figures & data
Figure 1. Grab™ by SOLWR.
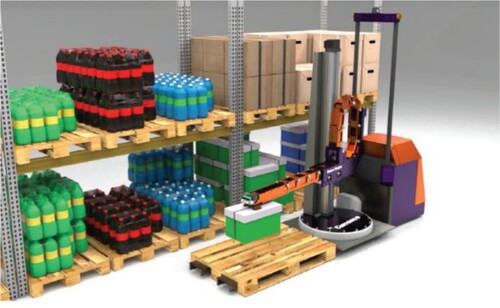
Table 1. Summary of literature on pick and transport robots in order picking system.
Figure 2. Warehouse layout of the case company.
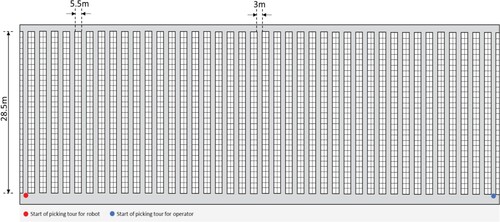
Table 2. Operational data about the order picker and current order-picking process at the case warehouse.
Table 3. Operational data about shelf layout and warehouse sizes.
Table 4. Operational data about the robot.
Figure 3. Performance outcomes in terms of daily cost, energy expenditure and error rate.
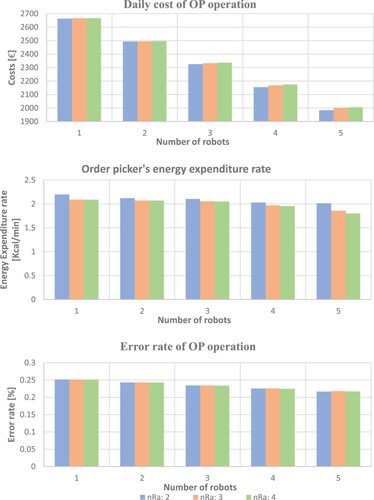
Figure 4. (a) Quantities (Qop, Qr), (b) lines (NLop, NLr) (c) orders (Zop, Zr) picked per worker (Nop, Nr).
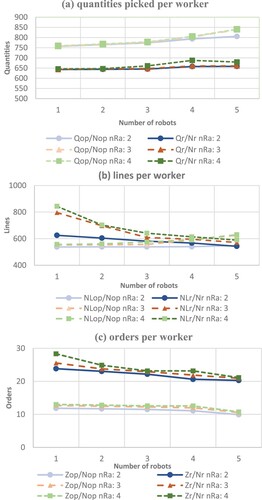
Figure 5. Performance outcomes for WH15 and LAY.
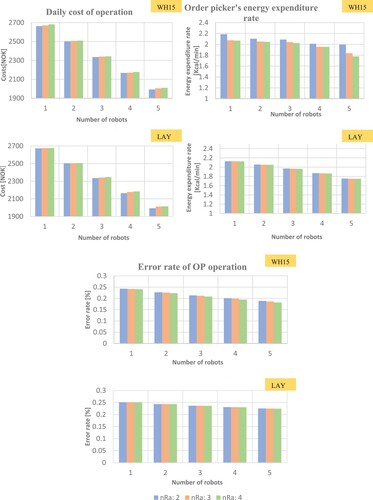
Figure 6. (a) Quantities (Qop, Qr), (b) lines (NLop, NLr) and (c) orders (Zop, Zr) picked per worker (Nop, Nr) for WH15 and LAY.
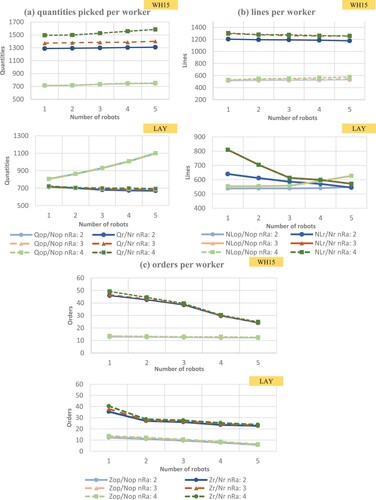
Table 5. Performance outcomes of the prime scenario.
Table 6. Performance outcomes for WH15 and LAY.
Data availability statement
The data that support the findings of this study are available from the corresponding author upon reasonable request.