
Figures & data
Figure 1. The scope of transparency, interpretability, and explainability.
A trapezoid that includes four layers. Starting at the top of the trapezoid, the first three layers are: transparency, interpretability, and explainability. The fourth bottom layer is split into two parts, science-centric and user-centric. Below the trapezoid, a box labelled ‘Model’ is presented with ‘Input’ and ‘Output’ arrow. The ‘Output’ arrow points to the ‘Users’.
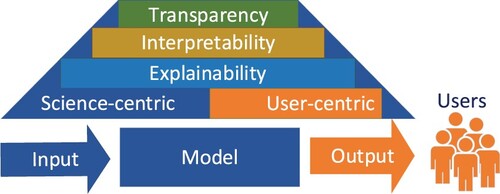
Figure 2. The initial decision tree.
A tree with three nodes and two arcs branching off each node depicted as circles. The nodes are labelled ‘P9’ (the top node), ‘P12’, and ‘P3’ (the bottom node). The first arc from the left connecting the ‘P9’ and ‘P12’ nodes is labelled ‘P9 < = 2.55’ and the second one branching off ‘P9’ ends with square A and is labelled ‘P9 > 2.55’. The first arc from the left connecting the ‘P12’ and ‘P3’ nodes is labelled ‘P12< = 6.05’ and the second arc branching off ‘P12’ ends with square B and is labeled ‘P12 > 6.05’. The first arc from the left branching off ‘P3’ node ends with square C and is labelled ‘P3 < = 3.6’. The second arc branching off ‘P3’ ends with square B and is labelled ‘P3 > 3.6’.
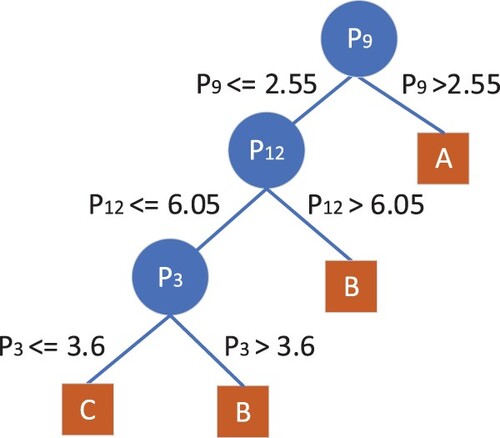
Table 1. The data set used to demonstrate the XRule algorithm.
Figure 3. Illustration of the process of deriving the XRule, IF ‘One_Condition’ THEN Decision = A.
A tree with three nodes depicted as ellipses and three arcs branching off each node. The nodes are labelled ‘All’ (the top node), ‘All – {P9}’, and ‘All – {P9, P7}’ (the bottom node). The middle arc connecting the ‘All – {P9’} and ‘All – {P9, P7}’ nodes is labelled P7 and it ends with square A and ‘IF P9 > 2.55 THEN A’ next to it. The left arc branching off node ‘All’ ends with circle P3, and the right arc off ‘All’ ends with end with circle P12. The middle arc connecting the ‘All’ and ‘All – {P9}’ nodes is labelled P7 and it ends with square A and ‘IF P7 = b2 THEN A’ next to it. The left arc branching off node ‘All – {P9}’ ends with circle P3, and the right arc branching off ‘All – {P9}’ ends with end with circle P12. The middle arc connecting the ‘All – {P9}’ and ‘All – {P9, P7}’ nodes is labelled P8 and it ends with square A and ‘IF P8 = a4 THEN A’ next to it. The left arc branching off node ‘All – {P9, P7}’ ends with circle P3, and the right one branching off the same node ends with circle P12.
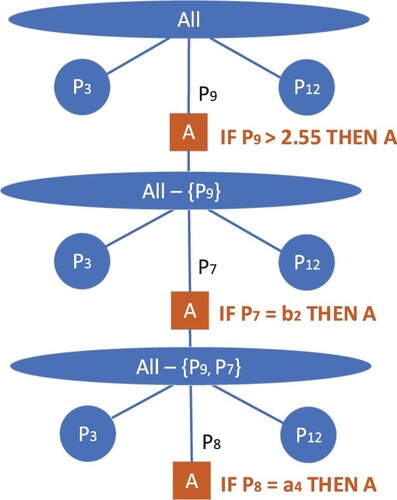
Figure 4. Illustration of the process of deriving the XRule, IF ‘One_Parameter’ THEN Decision = B.
A tree with two nodes depicted as ellipses and four arcs branching off each node. The nodes are labelled ‘All – {P7, P8, P9}’ (the top node) and ‘All – {P7, P8, P9} – {P12}’ (the bottom node). The third arc from the left connecting the ‘All – {P7, P8, P9}’ and ‘All – {P7, P8, P9} – {P12}’ nodes is labelled P12 and it ends with square B and ‘IF P12 > 6.05 THEN B’ next to it. The most left arc branching off node ‘All – {P7, P8, P9}’ ends with circle P3, next from the left ends with circle P5, and the arc most to the right ends with circle P11. The third arc from the left branching off node ‘All – {P7, P8, P9} – {P12}’ is labelled P13 and it ends with square B and ‘IF P13 > 0.1 THEN B’ next to it. The most left arc branching off node ‘All – {P7, P8, P9} – {P12}’ ends with circle P3, the next arc from the left ends with circle P5, and the most right one ends with circle P11.
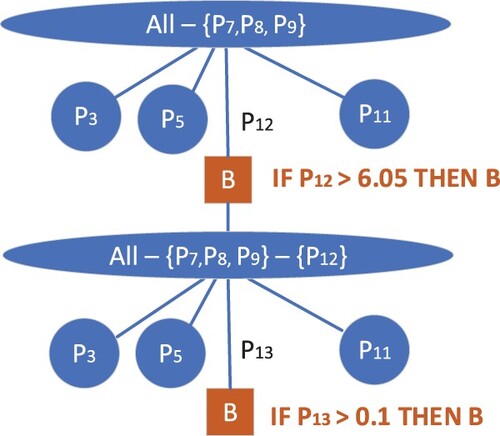
Figure 5. Illustration of the process of deriving the XRule, IF ‘One_Parameter’ THEN Decision = C.
A tree with two nodes depicted as ellipses and three arcs branching off each node. The nodes are labelled ‘All – {P7, P8, P9} – {P12, P13}’ (the top node) and ‘All – {P7, P8, P9} – {P12, P13} – {P11}’ (the bottom node). The middle arc connecting the ‘All – {P7, P8, P9} – {P12, P13}’ and ‘All – {P7, P8, P9} – {P11}’ nodes is labeled P11 and it ends with square B and ‘IF P11 > 2.1 THEN C’ next to it. The arc most left branching off ‘All – {P7, P8, P9} – {P12, P13}’ ends with circle P3 and the arc most to the right ends with circle P5. The middle arc branching off node ‘All – {P7, P8, P9} – {P12, P13} – {P11}’ is labelled P10 and it ends with square C and ‘IF P10 = b3 THEN C’ next to it. The most left arc branching off node ‘All – {P7, P8, P9} – {P12, P13} – {P11}’ is labelled P3 and the most right one ends with end with circle P5.
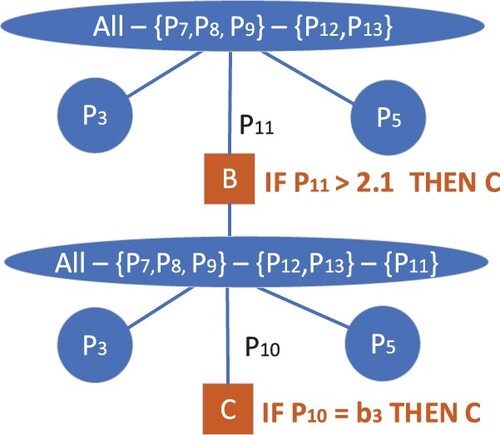
Figure 6. The concept of fXAI based on the XRule algorithm.
A three-level diagram. The flow of data depicted with arrows spans three block ‘Data’, ‘ML Algorithm’, and ‘Model’. An arrow links the block ‘Data’ to the second-level block ‘XRule Algorithm’. Three arrows point to the third-level blocks, ‘Perspective I’, ‘Perspective II’, and ‘Perspective III’.
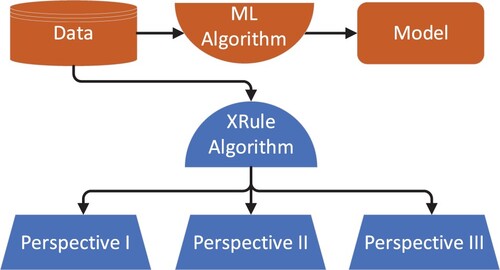
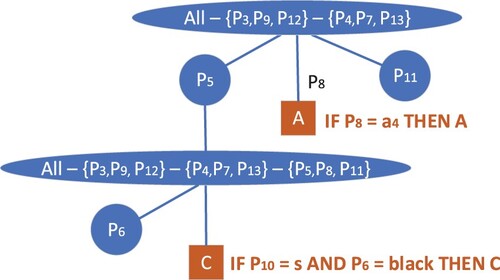
Figure 7. The XRules generated from the data set in Table in a federated mode.
A tree with two nodes depicted as ellipses and three arcs branching out of the top node and two arc branching out of the bottom node. The nodes are labelled ‘All – {P3, P9, P12} – {P4, P7, P13}’ (the top node) ‘All – {P3, P9, P12} – {P4, P7, P13} – {P5, P8, P11}’ (the bottom node). The middle arc branching out of the top node is labelled P5 and it connects to the bottom node. The arc most left out of the top ends with circle P11.
Data availability statement
Data sharing is not applicable to this article as all data is included in the manuscript.