
Figures & data
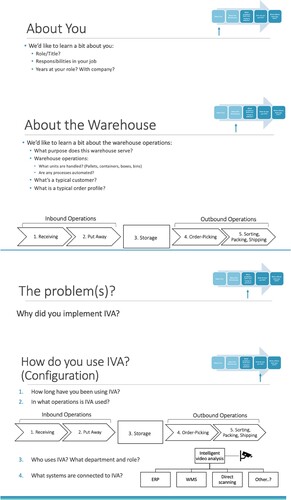
Figure 1. Overview of order fulfilment and warehouse operations.
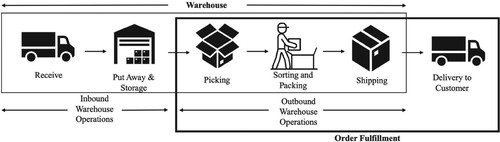
Figure 2. Illustration of how transactional data from information systems is matched with video of physical goods flow to enable the video analyst to search for and analyse recorded sequences.
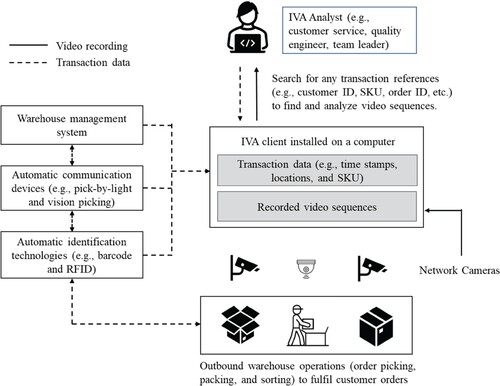
Table 1. Overview of case company characteristics.
Table 2. Summary of data collected from the case companies.
Figure 3. Example of causal map linking error types, causes, preventative actions, and observed effects of using intelligent video analysis.
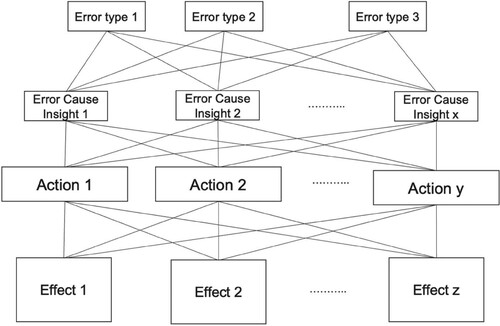
Figure 4. Observed relationship between error sources, how they are measured, and resulting error metrics.
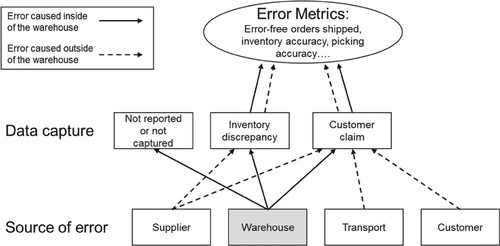
Table 3. Overview of benefits with intelligent video analysis for dealing with fulfilment errors made outside of the warehouse.
Figure 5. Accepted claims in relation to total order output at company E.
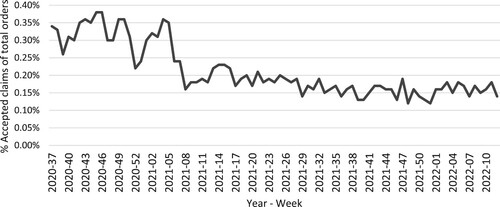
Figure 6. Links between errors made in outbound warehouse operations and the underlying causes.
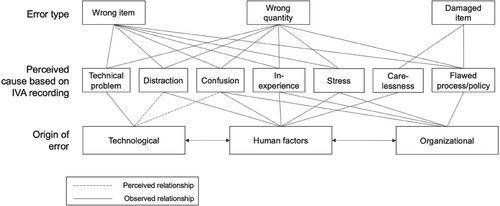
Table 4. Summary of different levels of using intelligent video analysis in feedback to employees based on our empirical findings.
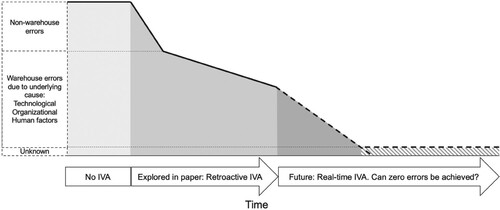
Figure 7. Conceptual illustration of how intelligent video analysis can impact a warehouse performance metric for fulfilment errors.
Data availability
The data that support the findings of this study are available from the corresponding author [[email protected]] upon reasonable request.