
Figures & data
Figure 1. The research methodology.
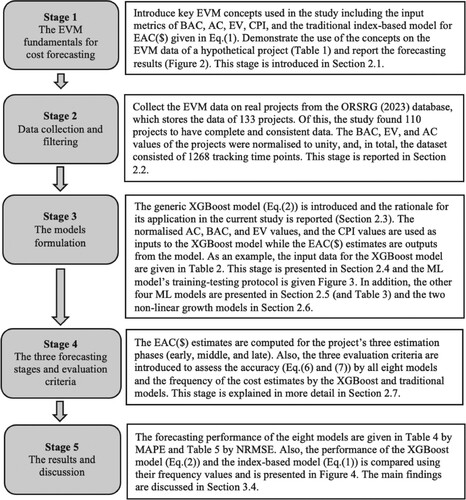
Figure 2. A typical cost S-curve of a project.
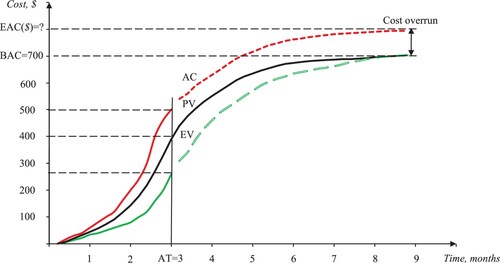
Table 1. The EVM data of a hypothetical project (the tracking period – month 3).
Table 2. The EVM data and inputs to the XGBoost model (the early-stage estimation).
Figure 3. The training-testing protocol of the ML algorithm.
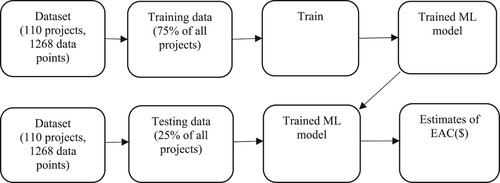
Table 3. The ML models, their parameter settings and explanation.
Table 4. The accuracy results of the forecasting models, MAPE%.
Table 5. The accuracy results of the forecasting models, NRMSE.
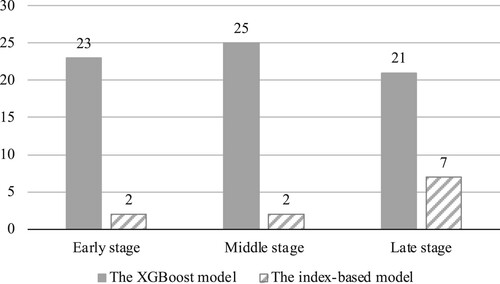
Figure 4. The number of more accurate cases (frequency of projects) by the XGBoost and index-based benchmark models.
Data availability statement
The authors confirm that the data supporting the findings of this study are available within the article and its supplementary materials.