
Figures & data
Table 1. Survey of the papers that address LSCP through mathematical programming models.
Figure 1. LSCP 4.0 modelling and experimentation methodology.
A process flow diagram is presented with the sequence of steps involved for the modelling and experimentation of LSCP 4.0.
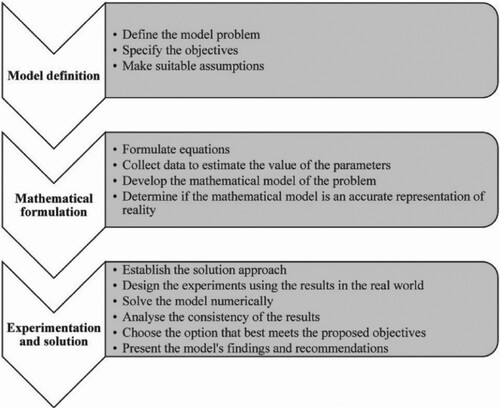
Figure 2. LSCP 4.0 design.
A lean SC structure is presented with three-dimensional icons considering information flows of: raw materials at levels one and two for aggregate demand, finished goods at levels three to five for two types of demand.
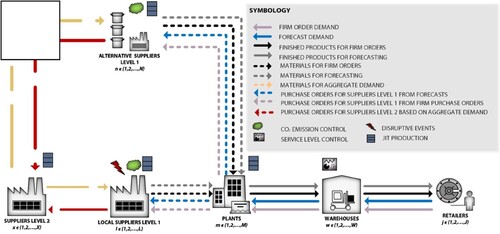
Table 2. Notation of the LSCP 4.0 model.
Table 3. Design of the experiments for each SC level.
Table 4. Objective function values and runtime per instance.
Figure 3. Relation between inventory cost and profits for the medium-sized problem.
A relation between inventory costs and total model profits is presented for each scenario of the performed experiments for the medium-sized problem.
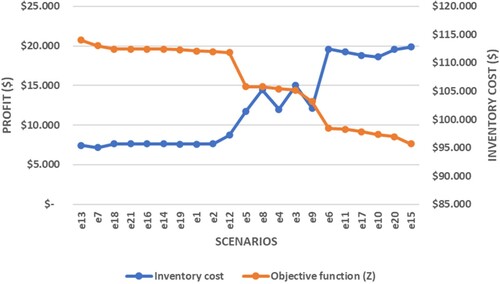
Table 5. Computational efficiency.
Table 6. Bullwhip effect measures.
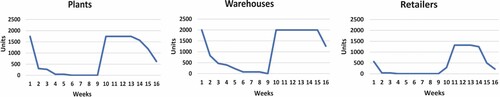
Figure 4. Supply chain net inventory amplification in scenario e7.
Representation of the amplification of net inventory propagating through three SC levels from retailer to manufacturer in scenario e7.
Supplemental material
Supplemental Material
Download MS Word (181.7 KB)Data availability statement
The authors confirm that the data supporting the findings of this study are available in the article and in Appendix.