
Figures & data
Figure 1. Stylised MCDM criteria selection process.
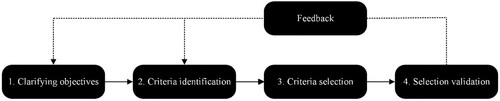
Table 1. Description of steps within the criteria selection process.
Figure 2. Example application of criteria selection process.
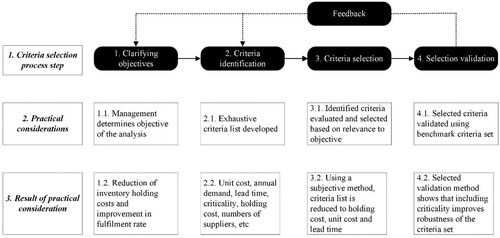
Figure 3. Process used to conduct the research, adapted from Ghadge et al. (Citation2022).

Figure 4. PRISMA data screening flow diagram.
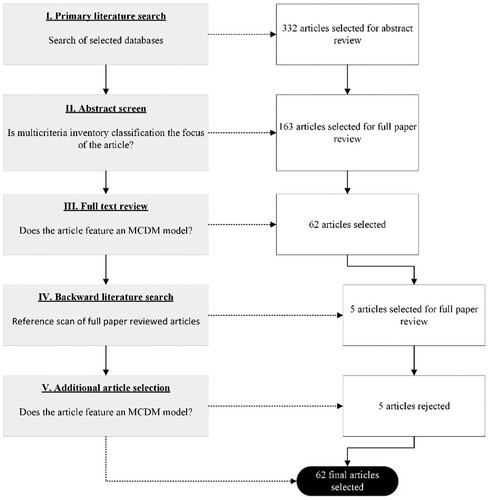
Figure 5. Comparison of publication trends for MCDM-based and non-MCDM-based inventory classification articles.
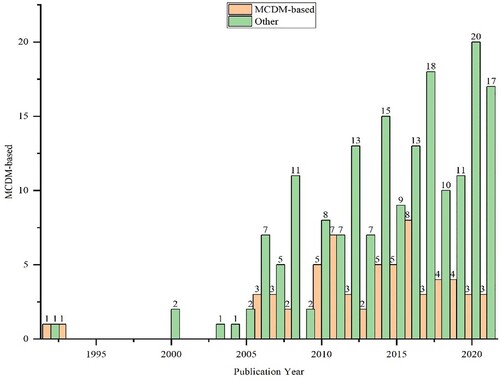
Figure 6. Top ten publication outlets for MCDM-based inventory classification research.
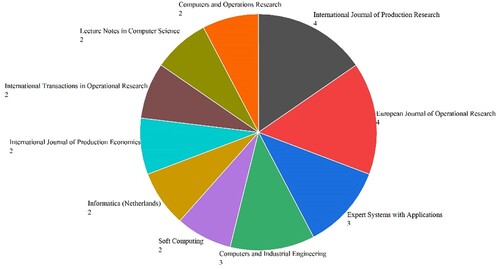
Table 2. Case-based inventory classification literature included in the review.
Figure 7. Criteria identification and selection methods used in case-based MCDM-based inventory classification research by MCDM model classification.
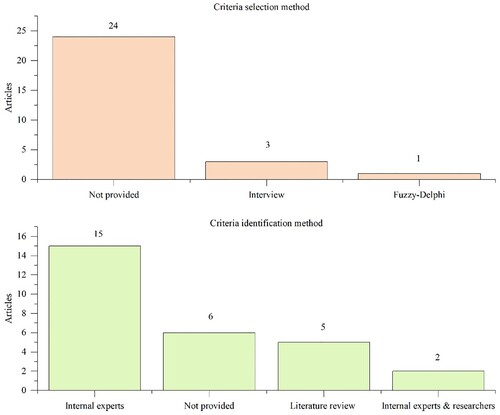
Table 3. Definitions of MCDM model classifications used in this review.
Table 4. MCDM-based non-inventory classification studies applying expert opinion and survey instruments for criteria validation.
Table 5. MCDM-based non-inventory classification studies applying expert opinion and interviews for criteria validation.
Table 6. Soft-OR approaches used for criteria validation in non-inventory classification MCDM-based studies
Data availability statement
Data sharing is not applicable to this article as no data were created or analysed in this study.