
Figures & data
Figure 1. An example of the complex energy flows of a factory integrated with RESs.
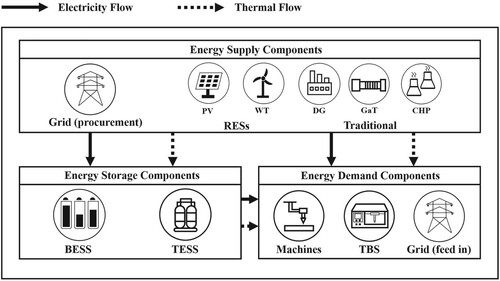
Figure 2. Classification of current research.
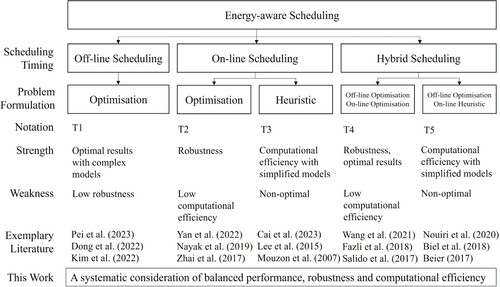
Figure 3. Framework and example of ETHS.
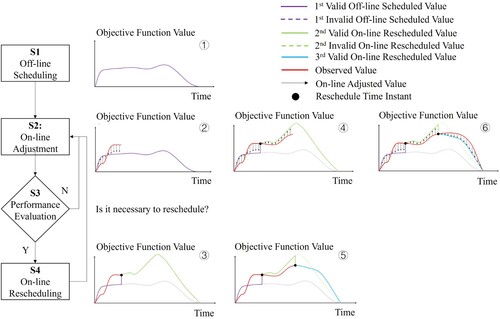
Figure 4. System components and energy flow of the factory.
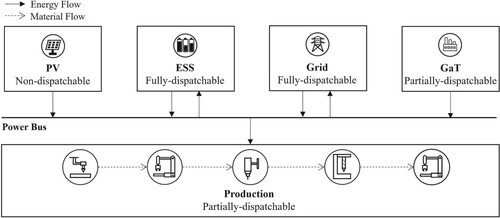
Table 1. States variables for the metal production factory.
Table 2. Parameters for the metal production factory.
Figure 5. Production schedule disturbance.
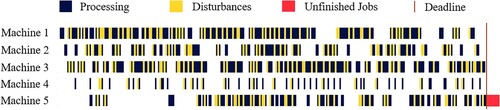
Figure 6. PV generation disturbance.
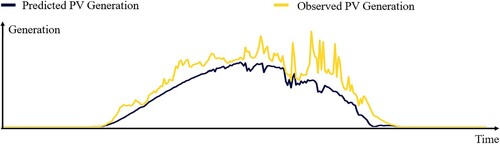
Table 3. Result of standard ETHS.
Figure 7. Schedule comparison with traditional methods.
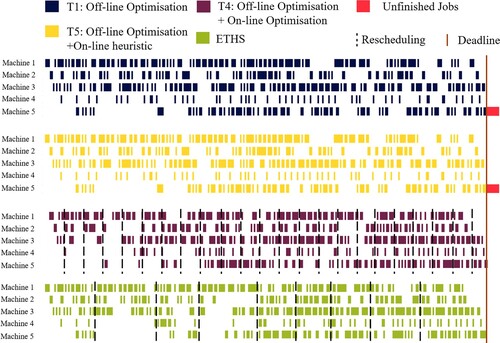
Table 4. Performance comparison with traditional methods.
Table 5. Sensitivity Analysis of S2, S3 and S4.
Figure 8. Gap between predicted and observed objective function value.
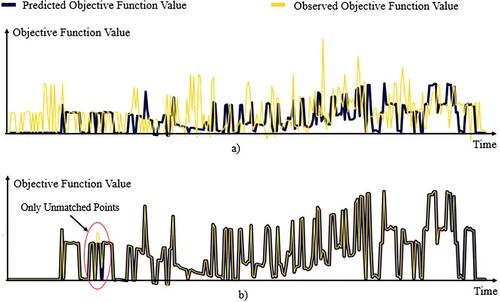
Table 6. Selection of different component categories.
Figure 9. Reschedule time steps comparison between two performance evaluation functions.
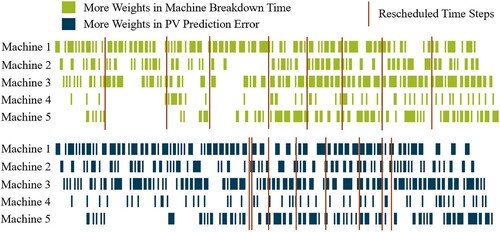
Table 7. Threshold comparison.
Data availability statement
The data that support the findings of this study are available from the corresponding author, [Li], upon reasonable requests.