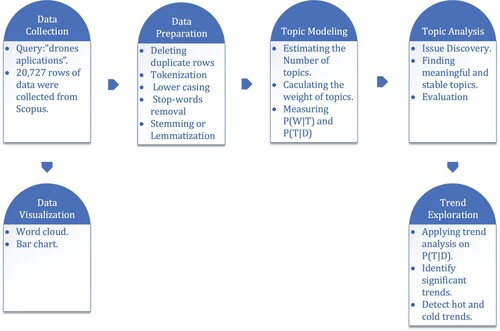
Figures & data
Table 1. Review studies on the applications of drones/UAVs.
Table 2. Initial search keywords.
Table 3. Secondary exclusion keywords.
Table 4. Missing data in every column of data.
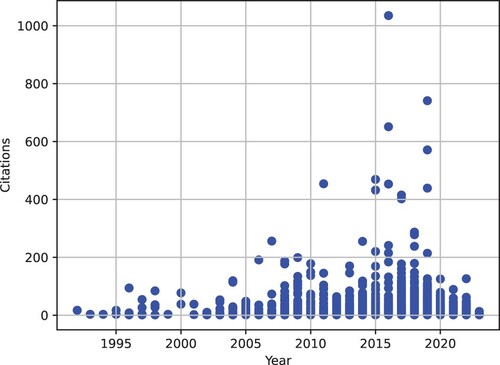
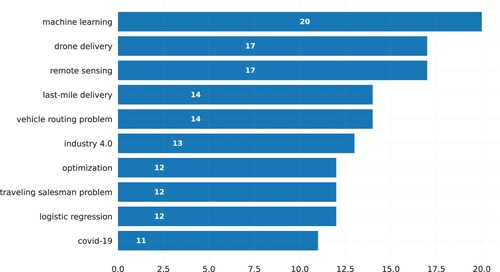
Table 5. Annual top 10 cited papers (Not survey studies).
Table 6. Annual top 10 cited papers per year (Not survey studies).
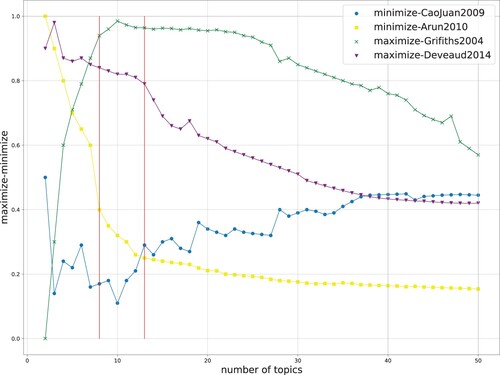
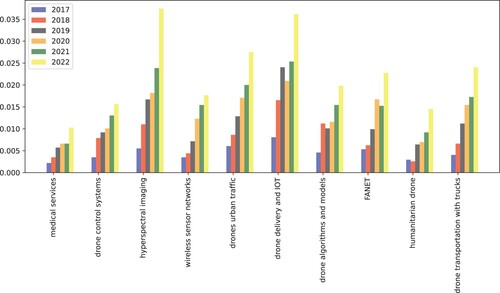
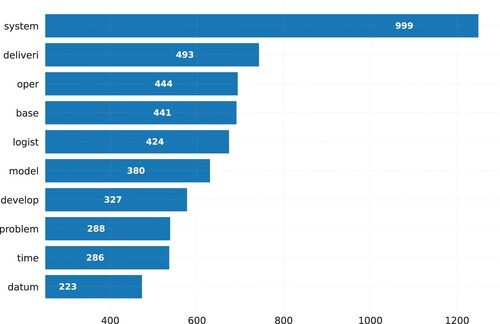
Table 7. Dominant topics and their top keywords (the numbers are the percentages contribution in each topic) using whole data set.
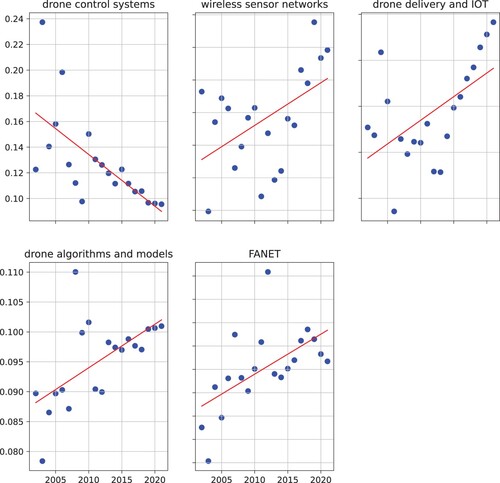
Table 8. Linear temporal trend of meaningful and stable topics related to drones applications (ns:  : Positive Slope; R<0: Negative Slope).
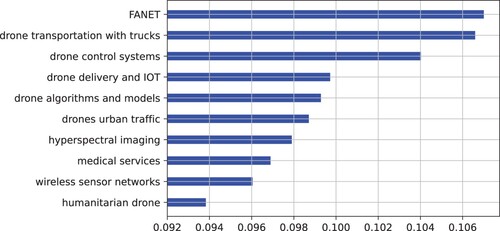
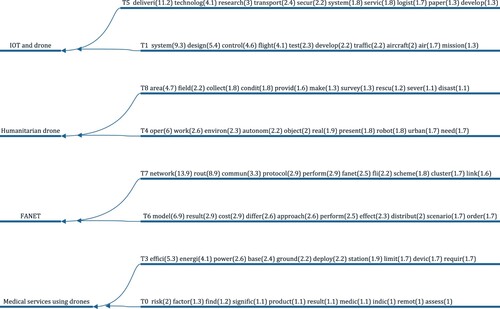
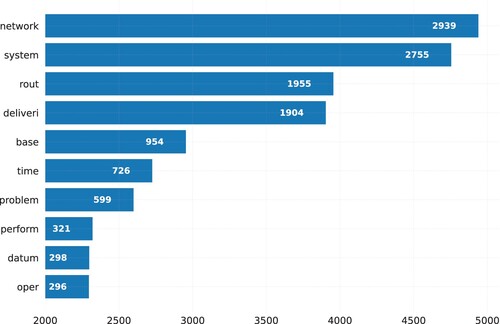
Table 9. Dominant topics and their most frequent keywords using only logistics and supply chain domain data.
Table 10. Final dominant topics of logistics and supply chain domain.
Bravo, R., and A. Leiras. 2015. “Literature Review of the Application of UAVs in Humanitarian Relief.” In Proceedings of the XXXV Encontro Nacional de Engenharia de Producao, Fortaleza, CE, 13–16. Allison, R. S., J. M. Johnston, G. Craig, and S. Jennings. 2016. “Airborne Optical and Thermal Remote Sensing for Wildfire Detection and Monitoring.” Sensors 16 (8): 1310. https://doi.org/10.3390/s16081310. Altawy, R., and A. M. Youssef. 2016. “Security, Privacy, and Safety Aspects of Civilian Drones: A Survey.” ACM Transactions on Cyber-Physical Systems 1 (2): 1–25. https://doi.org/10.1145/3001836. Lagorio, A., R. Pinto, and R. Golini. 2016. “Research in Urban Logistics: A Systematic Literature Review.” International Journal of Physical Distribution & Logistics Management 46 (10): 908–931. Lee, S., and Y. Choi. 2016. “Reviews of Unmanned Aerial Vehicle (Drone) Technology Trends and Its Applications in the Mining Industry.” Geosystem Engineering 19 (4): 197–204. https://doi.org/10.1080/12269328.2016.1162115. Natu, A. S., and S. Kulkarni. 2016. “Adoption and Utilization of Drones for Advanced Precision Farming: A Review.” International Journal on Recent and Innovation Trends in Computing and Communication 4: 563–565. Bhatt, K., A. Pourmand, and N. Sikka. 2018. “Targeted Applications of Unmanned Aerial Vehicles (Drones) in Telemedicine.” Telemedicine and E-Health 24 (11): 833–838. https://doi.org/10.1089/tmj.2017.0289. Büyüközkan, G., and F. Göçer. 2018. “Digital Supply Chain: Literature Review and a Proposed Framework for Future Research.” Computers in Industry 97: 157–177. https://doi.org/10.1016/j.compind.2018.02.010. Otto, A., N. Agatz, J. Campbell, B. Golden, and E. Pesch. 2018. “Optimization Approaches for Civil Applications of Unmanned Aerial Vehicles (UAVs) Or Aerial Drones: A Survey.” Networks 72 (4): 411–458. https://doi.org/10.1002/net.v72.4. Rosser, J. C., Jr., V. Vignesh, B. A. Terwilliger, and B. C. Parker. 2018. “Surgical and Medical Applications of Drones: A Comprehensive Review.” JSLS: Journal of the Society of Laparoendoscopic Surgeons 22 (3): e2018.00018. https://doi.org/10.4293/JSLS.2018.00018. Hildmann, H., and E. Kovacs. 2019. “Using Unmanned Aerial Vehicles (UAVs) As Mobile Sensing Platforms (MSPs) for Disaster Response, Civil Security and Public Safety.” Drones 3 (3): 59. https://doi.org/10.3390/drones3030059. Chung, S. H., B. Sah, and J. Lee. 2020. “Optimization for Drone and Drone-Truck Combined Operations: A Review of the State of the Art and Future Directions.” Computers & Operations Research 123: 105004. Gupta, L., R. Jain, and G. Vaszkun. 2016. “Survey of Important Issues in UAV Communication Networks.” IEEE Communications Surveys and Tutorials 18 (2): 1123–1152. https://doi.org/10.1109/COMST.2015.2495297. Hayat, S., E. Yanmaz, and R. Muzaffar. 2016. “Survey on Unmanned Aerial Vehicle Networks for Civil Applications: A Communications Viewpoint.” IEEE Communications Surveys and Tutorials 18 (4): 2624–2661. https://doi.org/10.1109/COMST.2016.2560343. Shakhatreh, H., A. H. Sawalmeh, A. Al-Fuqaha, Z. Dou, E. Almaita, I. Khalil, N. S. Othman, A. Khreishah, and M. Guizani. 2019. “Unmanned Aerial Vehicles (UAVs): A Survey on Civil Applications and Key Research Challenges.” IEEE Access 7: 48572–48634. https://doi.org/10.1109/Access.6287639. Ahmed, F., J. Mohanta, A. Keshari, and P. S. Yadav. 2022. “Recent Advances in Unmanned Aerial Vehicles: A Review.” Arabian Journal for Science and Engineering 47 (7): 7963–7984. https://doi.org/10.1007/s13369-022-06738-0. Rejeb, A., K. Rejeb, S. J. Simske, and H. Treiblmaier. 2023. “Drones for Supply Chain Management and Logistics: A Review and Research Agenda.” International Journal of Logistics Research and Applications 26 (6): 708–731. https://doi.org/10.1080/13675567.2021.1981273. Mohsan, S. A. H., N. Q. H. Othman, Y. Li, M. H. Alsharif, and M. A. Khan. 2023. “Unmanned Aerial Vehicles (UAVs): Practical Aspects, Applications, Open Challenges, Security Issues, and Future Trends.” Intelligent Service Robotics 16 (1): 109–137. Mozaffari, M., W. Saad, M. Bennis, Y. H. Nam, and M. Debbah. 2019. “A Tutorial on UAVs for Wireless Networks: Applications, Challenges, and Open Problems.” IEEE Communications Surveys & Tutorials 21 (3): 2334–2360. https://doi.org/10.1109/COMST.2019.2902862.