Figures & data
Table 1 Abbreviations, Country Sample Sizes (n), and Variable Means for 26 Countries
FIGURE 1 Correlation between normative views on government responsibility for environmental protection and support for increased government spending on the environment, by country.
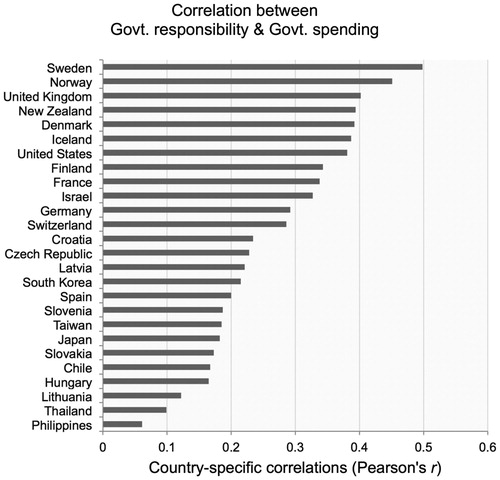
FIGURE 2 Scatterplot for the relationship between the strength of the responsibility-spending correlation and the quality of government (QoG).
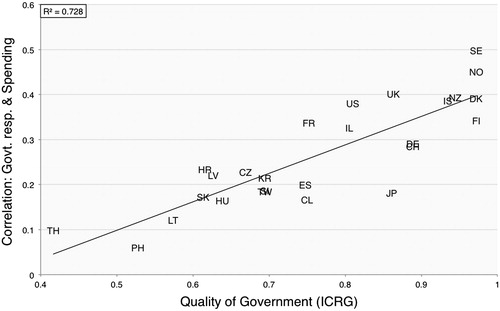
TABLE 2 Multilevel Models of Support for Government Spending on the Environment
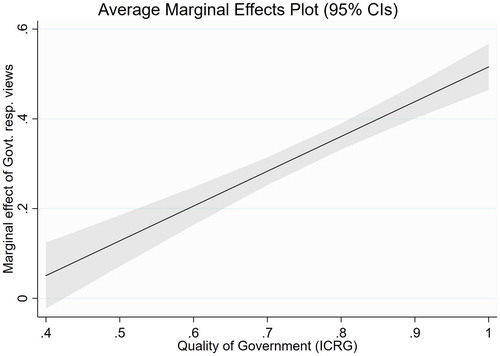
FIGURE 3 Marginal effect of views about government responsibility on support for government spending on the environment for different levels of quality of government (QoG).