
Figures & data
FIGURE 1 Aggregate support for redistribution and the size of redistribution among 23 OCED countries in 2016.
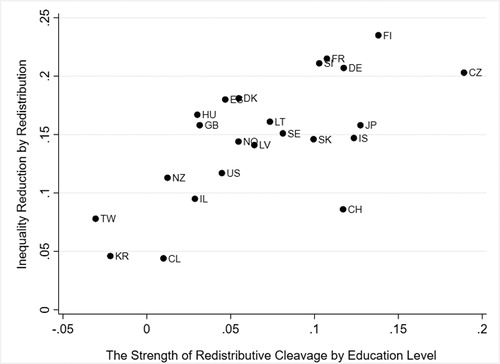
Notes: Based on the author’s calculation of ISSP 2016 data for the aggregate preferences and OECD and LIS data for the inequality reduction by government (the difference of Gini coefficients between pre- and post-redistribution household incomes multiplied by 100). Country abbreviations: Chile (CL), Czech Republic (CZ), Denmark (DK), Finland (FI), France (FR), Germany (DE), Hungary (HU), Iceland (IS), Israel (IL), Japan (JP), Latvia (LV), Lithuania (LT), New Zealand (NZ), Norway (NO), Slovakia (SK), Slovenia (SI), South Korea (KR), Spain (ES), Sweden (SE), Switzerland (CH), Taiwan (TW), the United Kingdom (GB), and the United States (US).
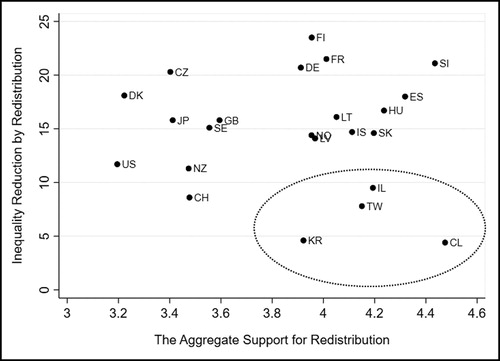
FIGURE 2 Two distinct approaches to redistributive preferences.
Notes: Three income groups are assumed to have a similar-size population. Redistributive preferences are scaled from 5 to 1, for which 5 indicates strong support for redistribution, 3 neutral, and 1 strong opposition to redistribution.
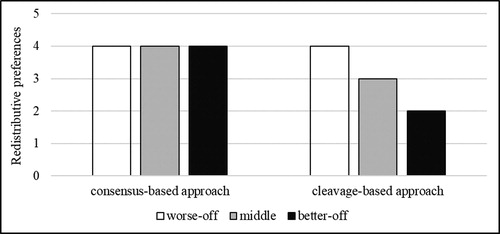
TABLE 1 Country-Specific Redistributive Cleavages in OECD Countries
TABLE 2 Strength of Redistributive Cleavages and Government Redistribution
FIGURE 3 Size of redistribution and strength of redistributive cleavage by education level.
APPENDIX A Country-Specific Redistributive Cleavages in OECD Countries