
Figures & data
Figure 1. Country differences for the worst off by mean levels of life satisfaction for the bottom 10%, the group between 10% and 50%, and the full sample.
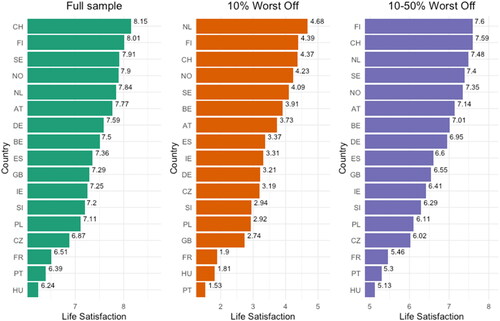
Figure 2. Changes in life satisfaction from first waves (2002-2004) to the last waves (2016-2018) for the for the bottom 10%, the group between 10% and 50%, and the full sample.
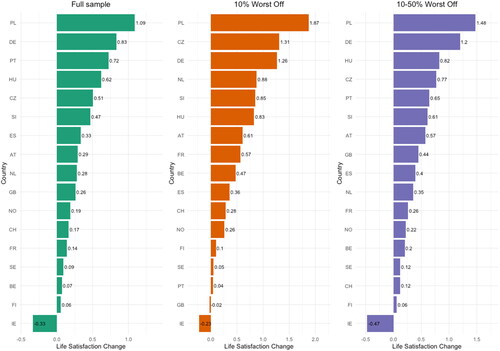
Table 1. Mixed model.
Table A1. Means, standard deviations and number of observations for life satisfaction across countries and groups in pooled samples of ESS wave 1-2 and 8-9.
Table A2a. Means, standard deviations and number of observations for financial satisfaction of the 10% worst off in life satisfaction across countries (wave 1 – 5).
Table A2b. Means, standard deviations and number of observations for financial satisfaction of the 10% worst off in life satisfaction across countries (wave 6 – 9).
Table A3a. Means, standard deviations and number of observations for the 10% worst off in life satisfaction across countries (wave 1 – 5).
Table A3b. Means, standard deviations and number of observations for the 10% worst off in life satisfaction across countries (wave 6 – 9).
Table A4a. Means, standard deviations and number of observations for full samples of life satisfaction across countries (wave 1 – 5).
Table A4b. Means, standard deviations and number of observations for full samples in life satisfaction across countries (wave 6 – 9).
Table A5. Log-Transformed GDP per Capita by country and wave.
Data availability statement
The data utilized in this study can be accessed publicly via the European Social Survey’s official website at https://www.europeansocialsurvey.org/.