Figures & data
Figure 1. Roadmap of the publication.
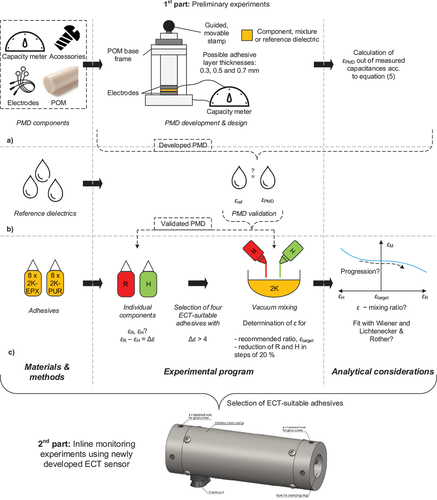
Table 1. Overview of investigated adhesives and associated mixing/processing conditions, all values taken from manufacturer’s technical data sheet (TDS).
Figure 2. Developed permittivity measurement device (PMD) with (1) base frame, (2) movable stamp, (3) stainless steel electrodes, and (4) precision shims.
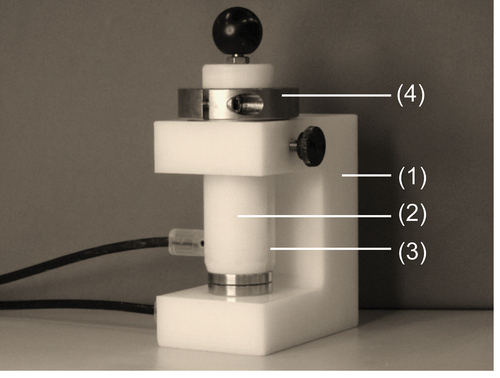
Table 2. Measuring range of PMD for determination of permittivity, εPMD, in dependency of adhesive layer thickness/shim height.
Figure 3. Illustration of PMD measurement procedure (herein for a correctly mixed 2K-EPX), all measurements performed at RT.
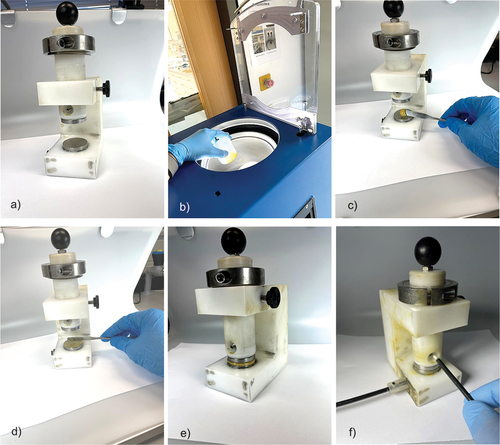
Table 3. Dielectrics of known permittivity taken from literature[Citation21] and used for the PMD validation.
Table 4. Experimental programme of unmixed and mixed adhesive components.
Table 5. Assumed values and constants for the analytical considerations to be inserted in the equations of W as well as L&R.
Figure 4. Determined permittivities of reference dielectrics measured with the developed PMD in comparison to known values from literature, values indicate arithmetic mean out of three repetition measurements, all measurements performed at RT.
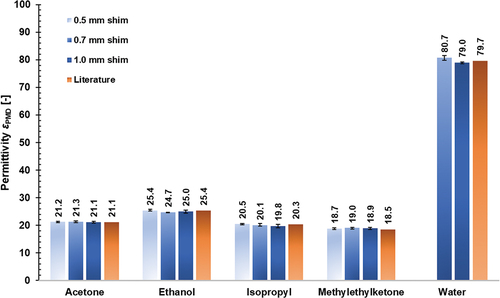
Figure 5. Determined capacities of reference dielectrics measured with the developed PMD (see section 2.2.2) in comparison to theoretical values calculated acc. to Equationequation 5(5)
(5) , all measurements performed at RT.
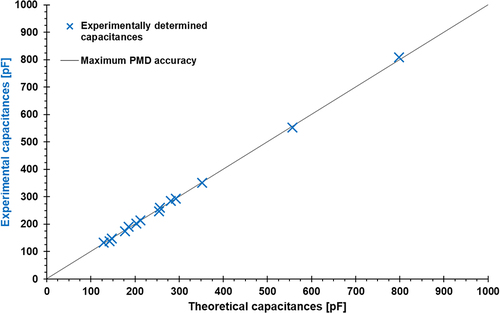
Figure 6. Results of PMD permittivity measurements for the 2K-EPX adhesives, all measurements performed at RT.
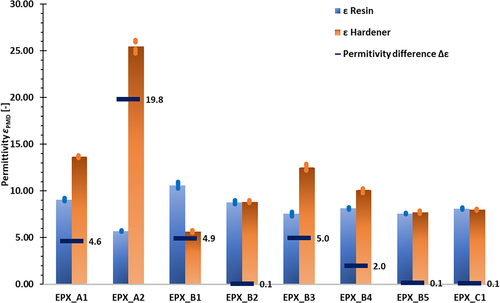
Figure 7. Results of PMD permittivity measurements for the 2K-PUR adhesives, all measurements performed at RT.
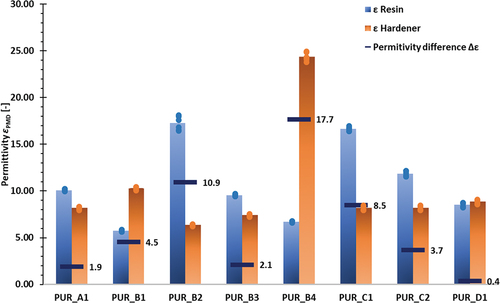
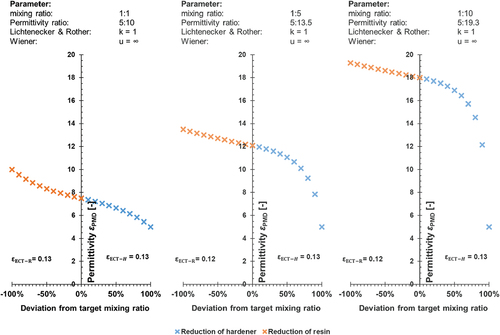
Figure 8. Dependency between experimentally determined permittivity, εPMD, of mixed adhesive components and mixing ratio for the adhesives EPX_A1 (left) and EPX_A2 (right) along with resulting fitting curve and associated shape coefficients of W as well as L&R; crosses indicate arithmetic mean of measured values (triple determination), all measurements performed with PMD (see section 2.2) at RT.
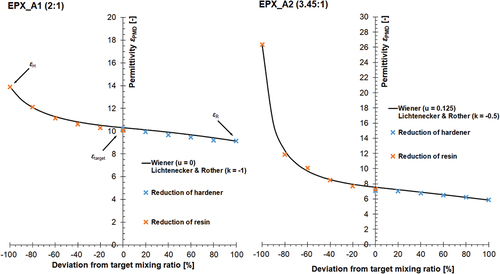
Figure 9. Dependency between experimentally determined permittivity, ε, of mixed adhesive components and mixing ratio for the adhesives EPX_B1 (left) and PUR_C1 (right) along with resulting fitting curve and associated shape coefficients of Was well as L&R; crosses indicate arithmetic mean of measured values (triple determination), all measurements performed with PMD (see section 2.2) at RT.
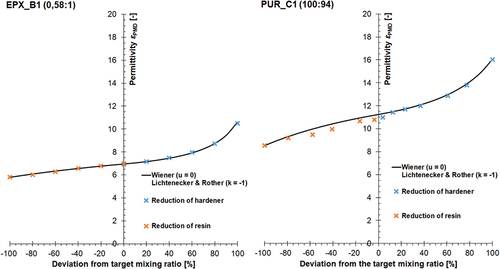
Table 6. Characteristic values of the permittivity-mixing-ratio-function of the representative ECT-suitable adhesives investigated, all values determined at RT.
Figure 10. Dependency of the ECT-index on the mixing ratio and the permittivity difference.