Figures & data
Table 1. Composition and appearance of polyurethane compounds.
Figure 1. Viscoelastic characteristics of polyurethane compounds with respect to temperature: (a) storage modulus E’, (b) loss modulus E”, and (c) loss factor tan δ.
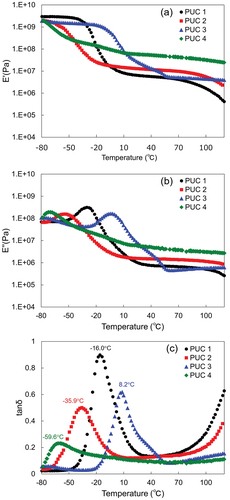
Figure 2. (a) Configuration and dimensions of specimen, (b) specimen for quasi-static tensile tests, and (c) specimen for high-strain-rate tensile tests.
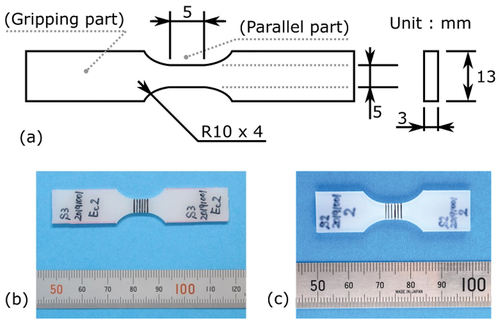
Figure 3. Mechanical material testing machine with a temperature chamber (above: overall view, below: close-up view of air flow system and specimen holder).
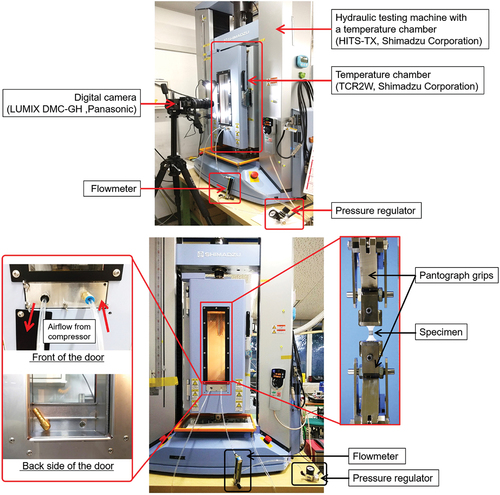
Figure 4. Hydraulic high-speed tensile testing machine with a temperature chamber.
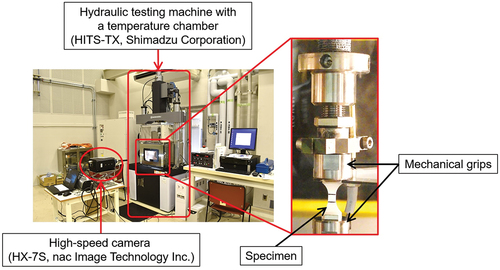
Figure 5. Typical SS curves of each polyurethane compound under static loading conditions: (a) RT, (b) −10°C, and (c) −40°C.
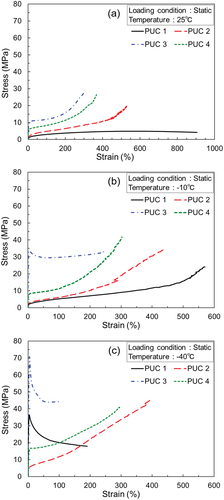
Figure 6. (a) Tensile strength and (b) elongation of each polyurethane compound under static loading conditions.
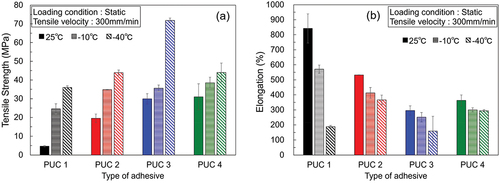
Figure 7. Typical SS curves of each polyurethane compound under high-strain-rate loading conditions: (a) RT, (b) −10°C, and (c) −40°C.
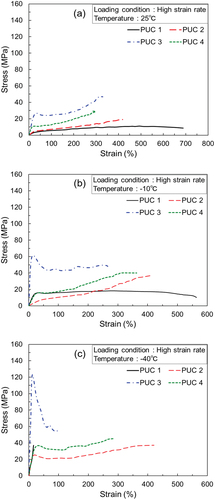
Figure 8. (a) Tensile strength and (b) elongation of polyurethane compounds under high-strain-rate loading conditions.
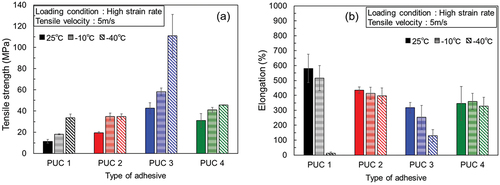
Figure 9. Deformation of PUC1 during high-speed tensile tests: (a) RT and (b) −40°C.
Figure 10. Deformation of PUC3 at high-speed rate tensile test at the temperature of – 40°C.
Figure 11. (a) Global and local SS curves of PUC3 at a temperature of −40°C under high-strain-rate conditions. The numbers on the SS curves correspond to the image numbers in . (b) Elongation at different measurement points (i.e. maximum ε1 and ε2) versus temperature.
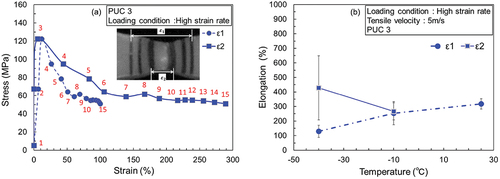
Figure 12. Time variation of global and local strain of PUC3 at a temperature of −40°C under high-strain-rate conditions. The numbers on the curves correspond to the image numbers in .
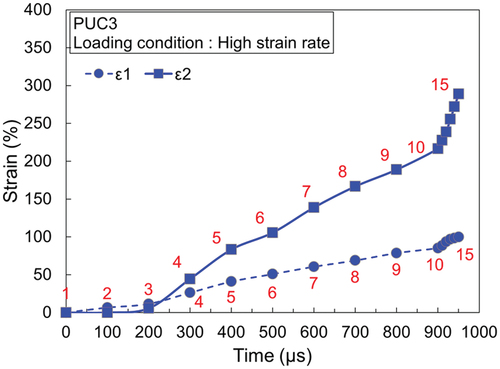
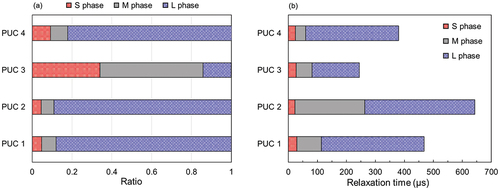
Figure 13. (a) Phase ratios and (b) relaxation times of polyurethane compounds evaluated by pulse NMR.