Figures & data
Table 1. Winter 2018/19 survey results, showing number of respondents with valid loss data, corresponding number of colonies going into winter, honey bee colony mortality rate and rates of loss due to queen problems and natural disasters (each with 95% confidence intervals (CIs)).
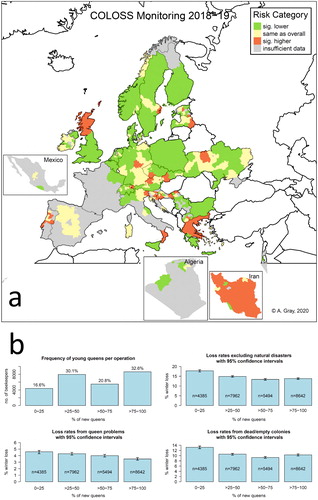
Figure 1. (a) Map with traffic-light colour coding showing relative risk of overwinter colony loss at regional level for participating countries.
Notes: Regions with a relative risk of loss (loss rate divided by the loss rate over all regions) that is significantly higher/lower than 1 are shown in red/green, respectively. Regions with a relative risk not significantly different from 1 are shown in yellow. Where no data were available or data were available from fewer than 6 beekeepers in a region within a participating country, this was treated as insufficient for reliable calculation and the region is shown in grey. Countries not present in the study are indicated in white (blank areas in the map). Information on region was not available for Poland, nor Malta (a small country), which were coloured at country level, as was Bulgaria (as numerous regions were represented but none with more than 5 beekeepers). Island groups/regions are also coloured as one region provided at least 6 responses were available.
(b) Barplots of results for percentage of young queens: distribution of beekeepers across each category of response (top-left), loss rates and 95% confidence intervals for each category of response for total losses excluding natural disasters (top-right), losses from queen problems (bottom-left) and losses from dead/empty colonies (mortality rate; bottom-right). Non-overlapping confidence intervals indicate categories that have significantly different loss rates.