Figures & data
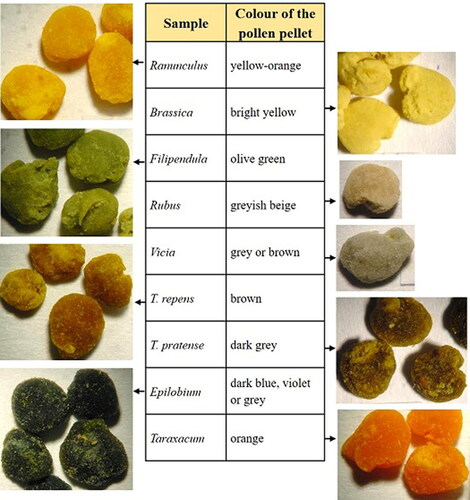
Table 1. Botanical origins, colours and collecting places of pollen pellet samples.
Table 2. Protein (% DW + s.e.) content in pollen pellet samples. Statistically significant differences at p < 0.05 (Tukey HSD) are marked with letters a-b.
Figure 1. A) Distribution of detected phenolics in different phenolic groups (mg g−1 FW) and B) total number of individual compounds and number of identical compound levels in the pollen pellets of different botanical origins.
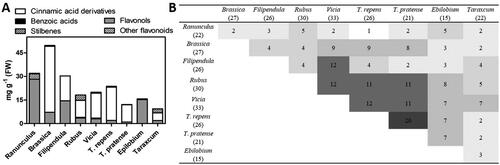
Figure 2. The percentage of inhibition of the pollen pellets extract in DPPH assay (mean ± s.e.). Statistically significant differences at p < 0.05 (Tukey HSD) are marked with letters a-d.
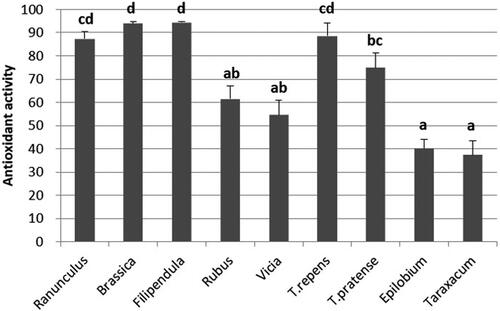
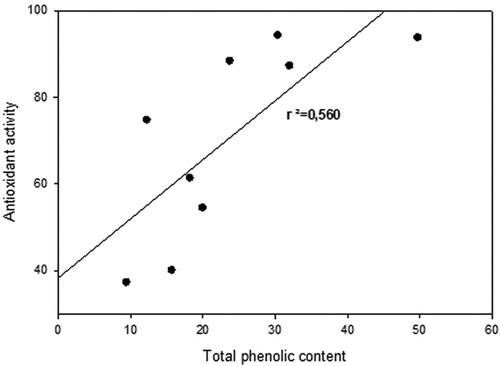
Figure 3. Correlation between total amounts of identified phenolic compounds (mg g−1 FW) and antioxidant activity (%).