Figures & data
Figure 1. Two different types of hives (Polyurethane, wood) used in this study as well as the overall average of both inner hive temperature and humidity for each hive groups. ANOVA was conducted at three levels of significance: *P < 0.05, **P < 0.01, ***P < 0.001.
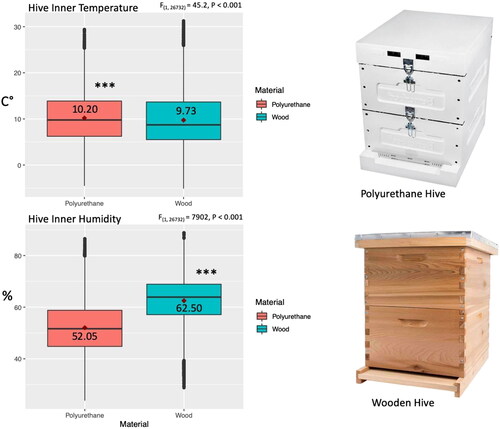
Table 1. Description of the studied hives and groups, numbers, location and inner-hive sensor used for data collection. Location and date of the study are also given.
Figure 2. Longitudinal display of temperature patterns for two randomly selected colonies; one from each studied group (Polyurethane and wooden hives). Temperature variations between day (sunshine to sunset) and night are displayed in boxplots for each hive type. ANOVA shows significant differences in hive inner temperature between day and night (P < 0.001) in both studied categories.
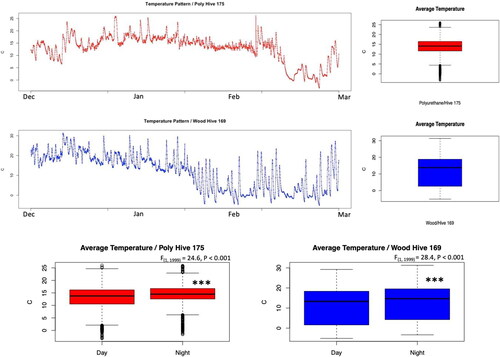
Figure 3. Humidity patterns (Dec to Mar) for two randomly selected colonies (same colonies of ); one from each studied group (Polyurethane and wooden hives). Overall average humidity is also given for each hive. In-hive humidity variations between day (sunshine to sunset) and night are displayed in boxplots for each of the two hive types. Statistical analysis (ANOVA) was conducted at 95% confidential interval and shows significant differences in inner hive humidity between day and night.
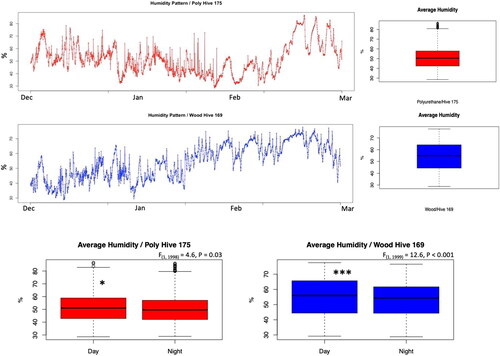
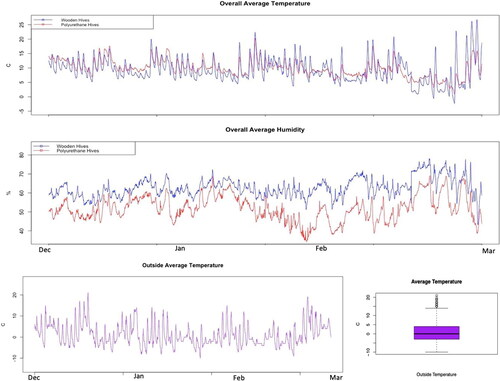
Figure 4. Overall average temperature and humidity for all studied colonies (18) displayed in a longitudinal fashion (Dec to Mar) for each of the two studied hive types (Wooden and polyurethane hives). Daily and average outdoor temperatures of the experimental site are also given.