Figures & data
Figure 1. Number of workers estimated in each colony (Bombus sp.) at selected times. The dashed lines connect the points and should be only seen as a guide to an eye. B. hortorum and B. hypnorum colonies survived until the decline while the other four colonies show only the data until the wax moth infestation.
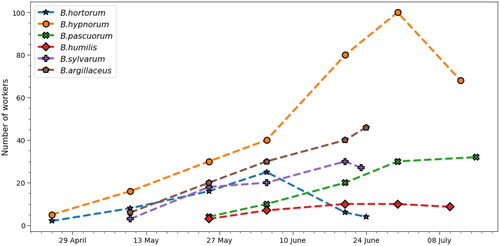
Table 1. Overview of relevant dates for the colonies in the study (all dates are in 2019).
Figure 2. Brood and reference sensor temperature as a function of time for the Bombus hortorum colony. While the nest temperature fluctuates strongly according to the outside air temperature (orange line), brood is maintained relatively steady at temperatures between 30 and 35 °C in the first weeks, with only minor drops during the colder times of the day. For details, see the text.
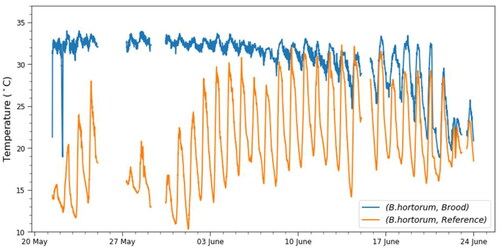
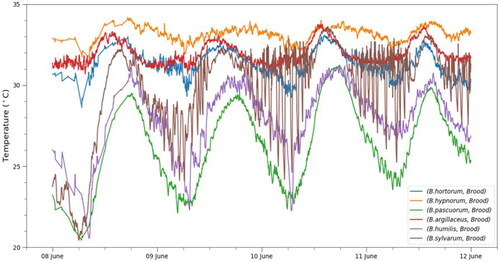
Figure 3. Temperature profiles for the brood in all six colonies (Bombus sp.) for 96 hours in June. The tick at 8 June corresponds to midnight.