Figures & data
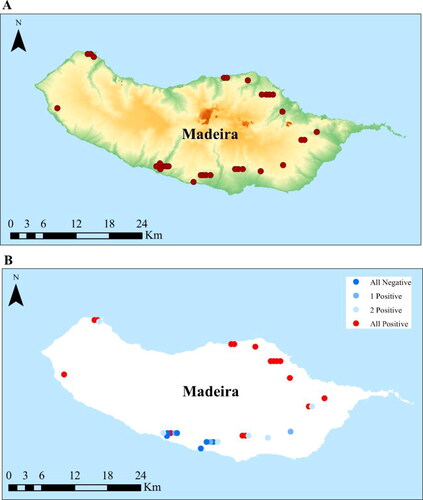
Figure 1. Map of Madeira showing (A) the orography of the island, with the location of the sampled apiaries, and (B) the location of the apiaries with the three sampled colonies N. ceranae-positive (red dots), two colonies N. ceranae-positive (light blue dots), one colony N. ceranae-positive (blue dots), and no N. ceranae-positive colonies (dark blue dots).