
Figures & data
Figure 1. Locations of A. cerana sampling sites.
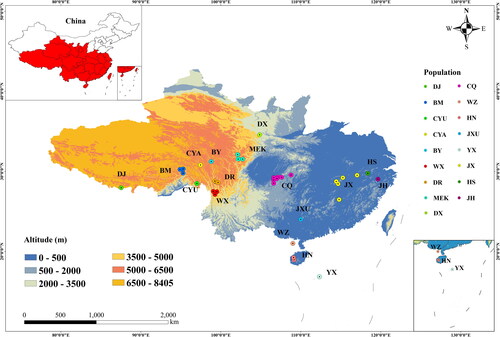
Figure 2. Discriminant analysis plot of A. cerana populations based on colony means of 32 characters measured (LD1 vs. LD2), with confidence ellipses at 95%. Each symbol represents one colony. All reference populations (CQ, HS, JH, JX, and JXU) are shown in gray with different shapes for different populations.
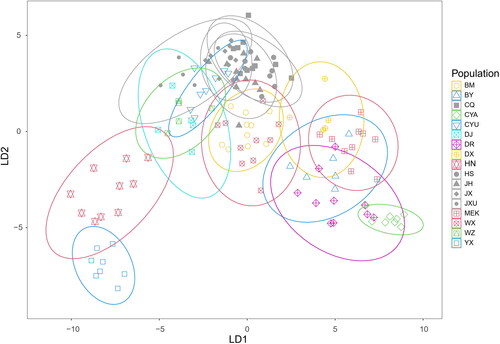
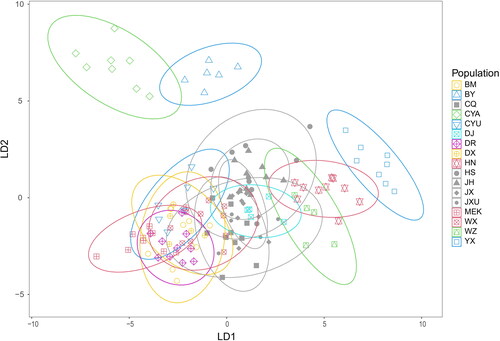
Figure 3. Discriminant analysis plot of A. cerana populations based on wing shape (LD1 vs. LD2), with confidence ellipses at 95%. Each symbol represents one colony. All reference populations (CQ, HS, JH, JX, JXU) are shown in gray with different shapes for different populations.
Supplemental material