Figures & data
Table 1. Description and distribution of the studied hives and the landscape composition for each location. Identification of mtDNA haplotypes and honey bee subspecies using the in silico DraI mtDNA COI-COII test. S: structure of the COI-COII intergenic region, L: evolutionary lineage.
Figure 1. Landscape composition and land use at the three studied locations and apiaries (1- Mansion: Urban area, 2- Meadow: Agricultural area, 3- Refuge: Non-agricultural area). Total number of colonies per location (n = 7), (2.3 km) is the estimated foraging distance.
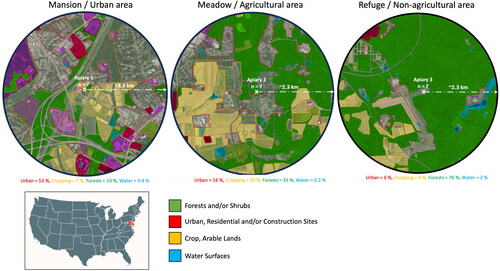
Figure 2. Overall inter-colony differences of weight, temperature and humidity are displayed per location. Alphabetic letters are the colonies’ codes. Kruskal-Wallis test shows significant differences (p < 0.001) among colonies for all studied variables. Boxplots represent the median, first and third quartiles, and both maximum and minimum values. No outliers were excluded.
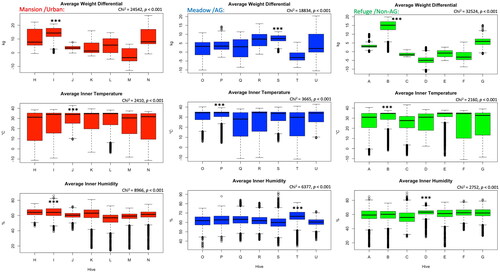
Figure 3. Inter-location comparisons of the overall colony weight gain, inner temperature and humidity. Correlations at a p < 0.001 cutoff were calculated for each studied variable (weight, temperature and humidity) among locations. Boxplot median values are displayed in white font. R value is given within each pairwise correlation circle. Kruskal-Wallis levels of significance are p < 0.05*, p < 0.001***.
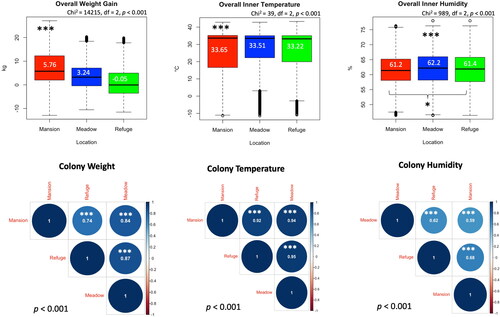
Figure 4. Varroa mite load in the studied colonies displayed longitudinally (month) and as overall averages per location and mtDNA haplotype. No significant differences were found at any time point.
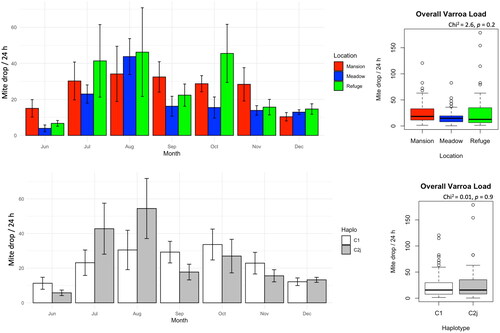
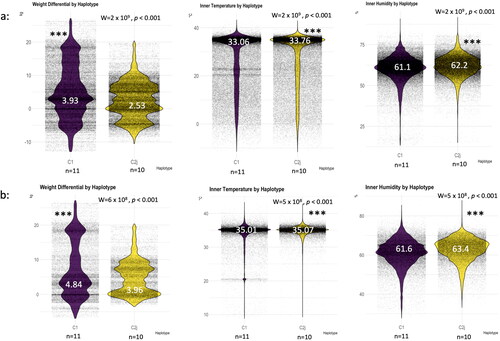
Figure 5. Haplotype thermoregulation and weight gain irrespective of the location. Overall averages of the studied variables (weight, temperature, humidity) throughout the four seasons (a), overall averages excluding the winter season (b). (n) number of haplotype/colony averaged in each category, median is given for each boxplot in white font. Wilcoxon level of significance is p < 0.001***.