
Figures & data
Figure 1. Students’ overall score in the test. Students at ISCED 2 are visualised in the light shade, ISCED 3 in the dark shade. Maximum score was 10.
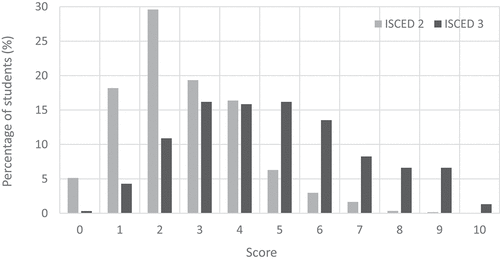
Table 1. Overall results and rate of detected misconceptions and their types in TASK 1.
Table 2. Overall results and rate of detected misconceptions and their types in TASK 2.
Table 3. Overall results and rate of detected misconceptions and their types in TASK 3.
Table 4. Overall results and rate of detected misconceptions in TASK 4–8.
Table 5. Overall results and rate of detected misconceptions in TASK 9 and 10.