Figures & data
Figure 1. Variation of as a function of α .
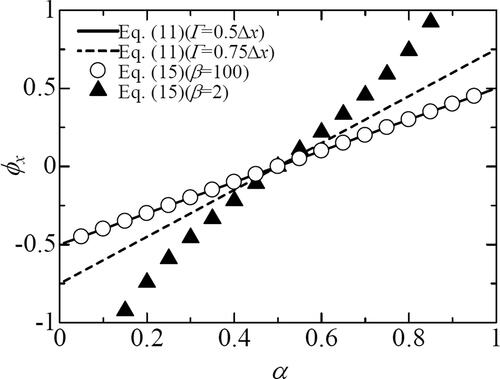
Figure 2. Location of
and
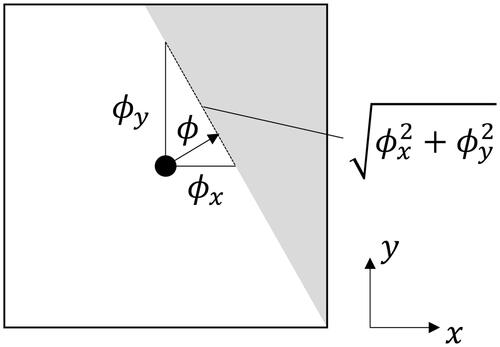
Figure 3. Schematic of Test A.
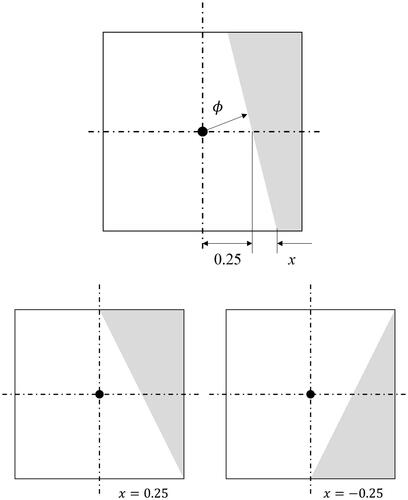
Figure 4. Two-dimensional test for (Run A). (a) Result of run A. (b) Zoom of .
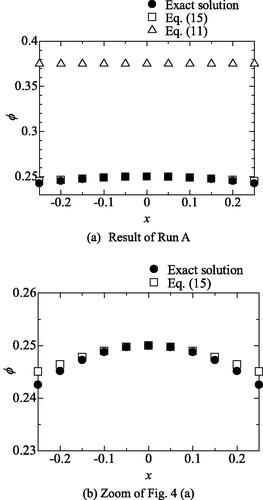
Figure 5. Two-dimensional test for (Run B). (a) Schematic of test B. (b) Result of run B.
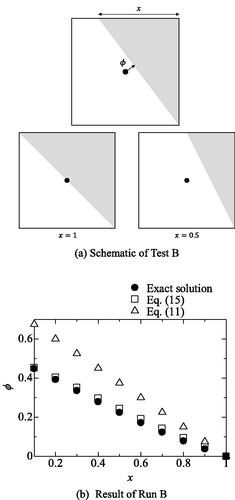
Figure 6. Variable arrangement in a cell.
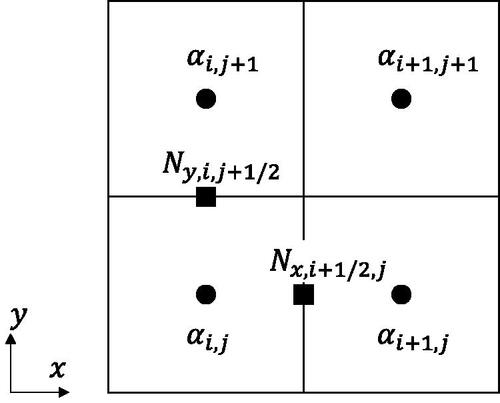
Figure 7. Calculation procedure.
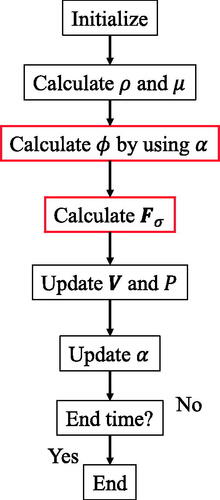
Table 1. Numerical schemes in the present study.
Table 2. Method for calculation of surface tension.
Table 3. Physical properties.
Table 4. Grid size resolution.
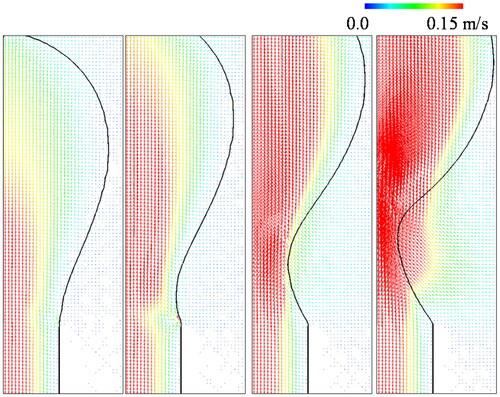
Figure 8. Velocity profiles at t = 0.1 s (Bubble case, resolution:L2). (a) Numerical results obtained by the original Method A. (b) Numerical results obtained by Method B. (c) Numerical results obtained by the Method C.
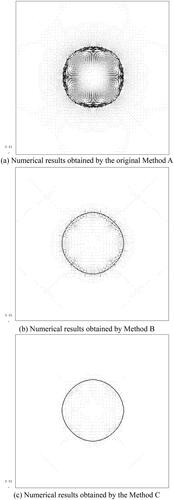
Table 5. Comparison of the value of two errors.
Figure 9. Boundary conditions.
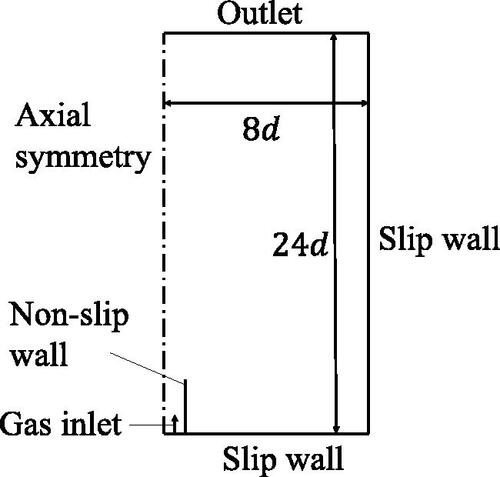
Table 6. Condition of calculation.
Figure 10. A sequence of calculated bubble formations (left: CLSVOF by Ohta et al. (Citation2011), right: Proposed method, is dimensionless time).
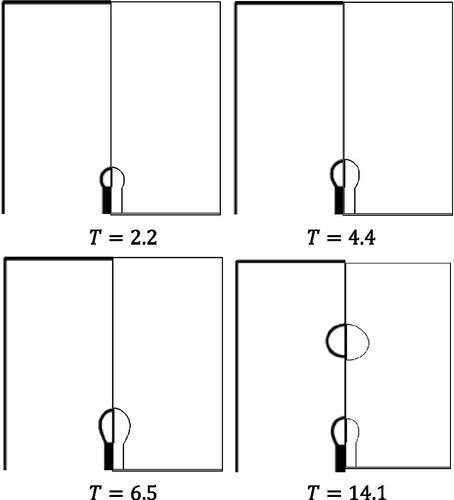
Figure 11. A sequence of pinch-off.