Figures & data
Figure 1. Impact of additive agents on leaching performance of Pt. Solvent: P66614Cl. Additive agents: MSA 13.8 wt.%, TCCA 5.3 wt.%. Conditions: 0.5 g/L, 353 K, 400 rpm, 24 h.
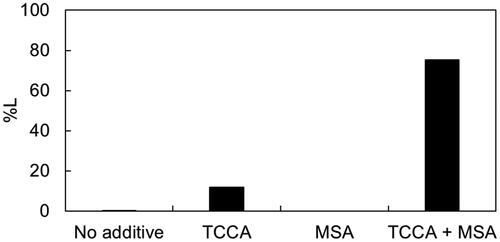
Figure 2. Impact of solvent on leaching of Pt powder. Additive agents: MSA 13.8 wt.%, TCCA 5.3 wt.%. Conditions: 0.5 g/L, 353 K, 400 rpm, 24 h.

Figure 3. Variation in leaching efficiency with time. Solvent: P66614Cl. Additive agents: MSA 13.8 wt.%, TCCA 5.3 wt.%. Conditions: 0.5 g/L, 353 K, 400 rpm, 1–48 h.
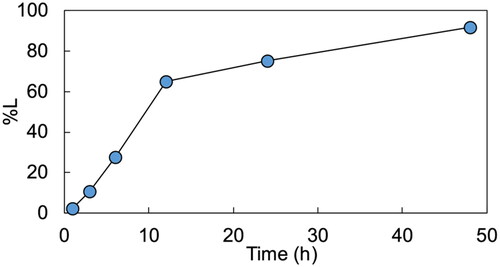
Figure 4. Kinetic plots for rate-limiting steps, corresponding to (a) diffusion and (b) surface chemical reaction.
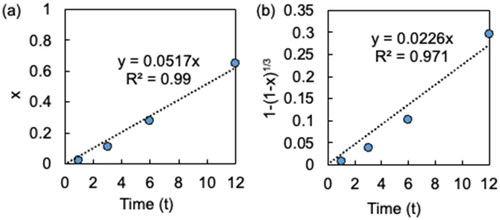
Figure 5. Ultraviolet–visible spectra of Pt standard solution (green dotted line), the IL before leaching (blue dotted line) and after leaching (red line). Condition: 298 K.
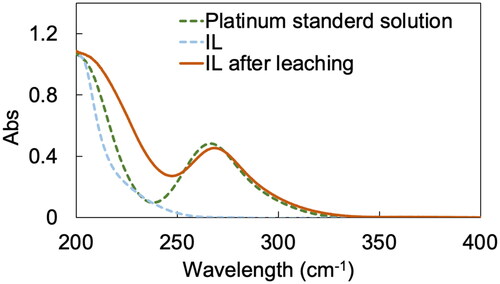
Figure 6. Stripping efficiencies of Pt from metal-loaded IL. Conditions: A:O = 2:1, 298 K, 24 h.
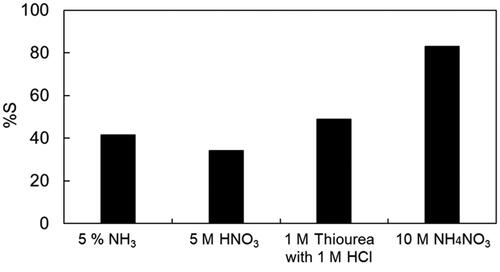
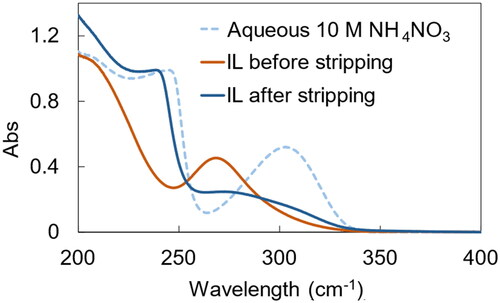
Figure 7. Ultraviolet–visible spectra of ionic liquid before and after stripping by 10 M NH4NO3 (red and blue lines, respectively) and aqueous 10 M NH4NO3 solution (blue dotted line). Condition: 298 K.