
Figures & data
Figure 1. 350 MW boiler: (a) geometry model; (b) boiler meshing.
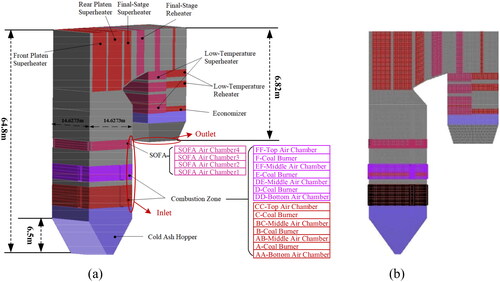
Table 1. Industrial analysis of coal quality.
Table 2. Elemental analysis of coal quality.
Table 3. Description of numerical simulation boundary conditions.
Figure 2. Heat flux distribution of furnace wall.
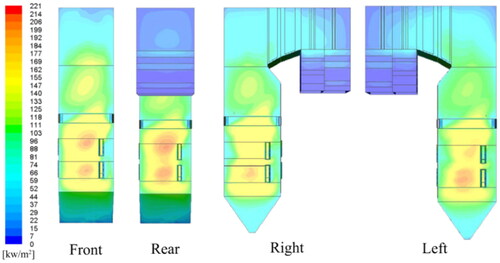
Figure 3. Framework of heat flux distribution fast prediction in boilers using computational fluid dynamics simulation data via multi-extreme learning machines.
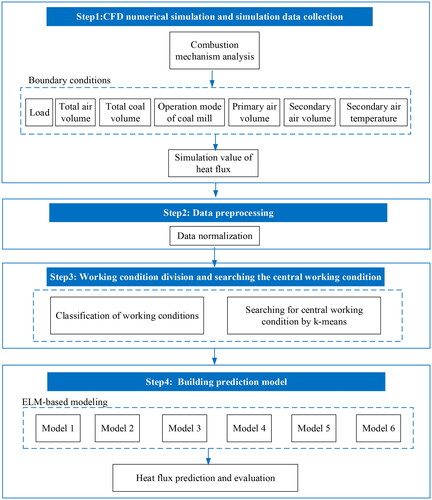
Table 4. Classification of 120 operating conditions.
Figure 4. Structure of ELM network for prediction of heat flux distribution.
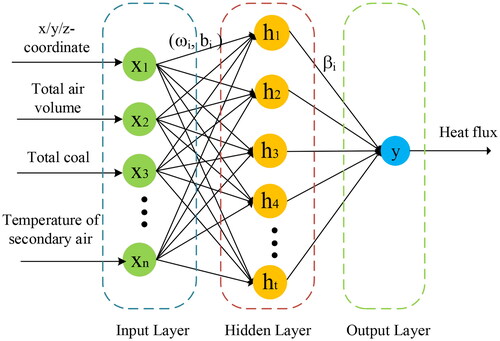
Table 5. MMAE values of the six prediction models.
Figure 5. Prediction error distribution of T10 operating condition.
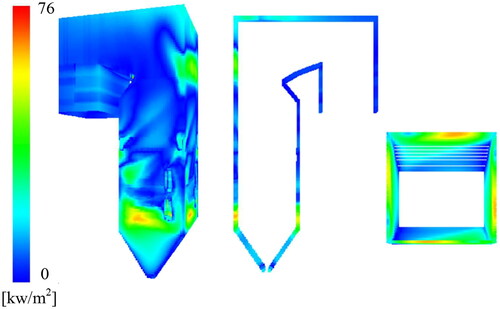
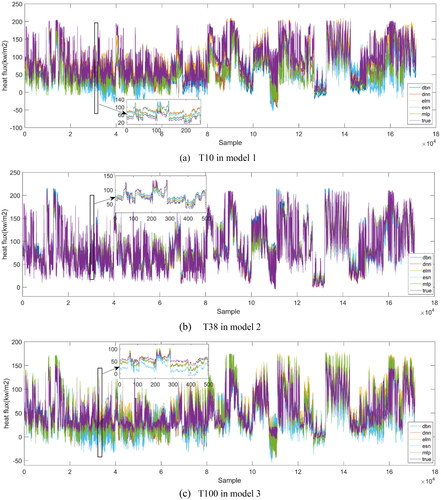

Table 6. The hyperparameter settings of the comparison model.
Figure 7. 3D simulation results of different modeling algorithms under T10 operating condition.
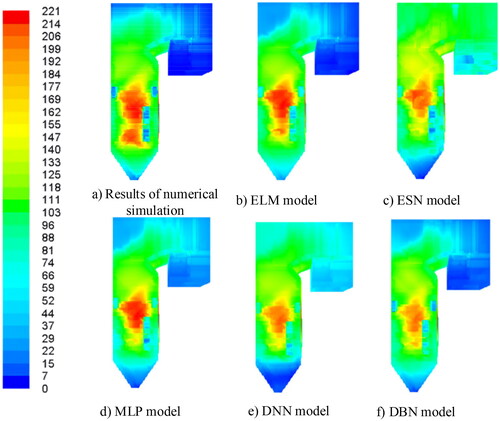
Table 7. Comparison of experimental results with different algorithms.
Figure 8. Prediction results with different algorithms under different loads.
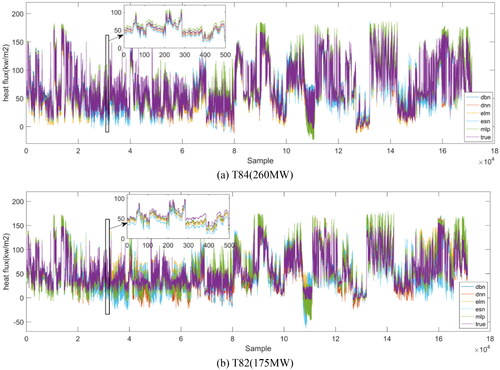
Table 8. Model evaluation with different algorithms under different loads.