Figures & data
Figure 1. (a) Schematic figure of cone-shaped pellets, core-shell cone-shaped pellets, and hollow cone-shaped pellets. (b) Schematic figure for equation describing lateral surface of the cone-shaped catalyst.
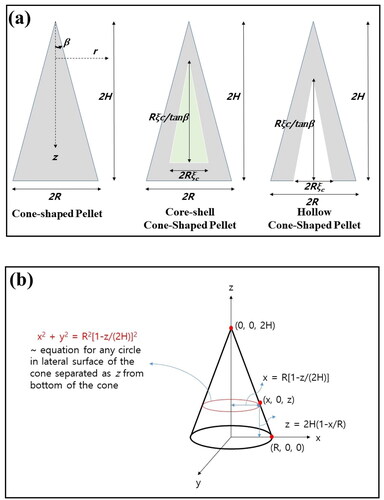
Figure 2. (a) Concentration profile of reactant inside cone-shaped pellet at steady state. Bi was 0.2 and ∞, while β was 1 and 60°. (b) Steady-state intra-particle concentration of cone-shaped pellet as a function of ζ at ξ = 0 for various Φ. Bi and β were fixed as 20 and 150, respectively. And intra-particle concentration of cone-shaped pellet as a function of (c) ζ at ξ = 0 and (d) ξ at ζ = 1 at steady state for various Bi. Φ and β were 5 and 15°, respectively.
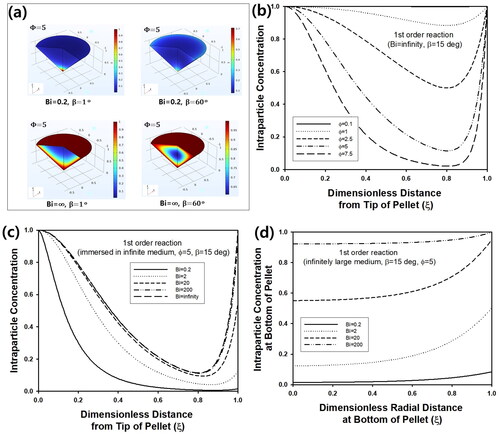
Figure 3. (a) Effectiveness factor (η) of cone-shaped pellet with β = 45° as a function of generalized Thiele modulus (Λ) for various mesh sizes. Inset graph contains η vs Φ for β = 45°. (b) η of cone-shaped pellet as a function of Φ for various β, assuming Bi → ∞. Inset graph contains η vs β for Φ = 10. (c) η of cone-shaped pellet as a function of generalized Thiele modulus (Λ), assuming Bi → ∞. (d) η of cone-shaped catalyst with β = 30° for isothermal first order reaction calculated from 2D axisymmetric geometry (red line). Black lines indicate η of the same catalytic pellet constructed as 3D structure. Number of meshes for finite element calculations were varied using normal to extrafine mesh. Inset figure contains cone-shaped catalyst constructed using 3D geometry.
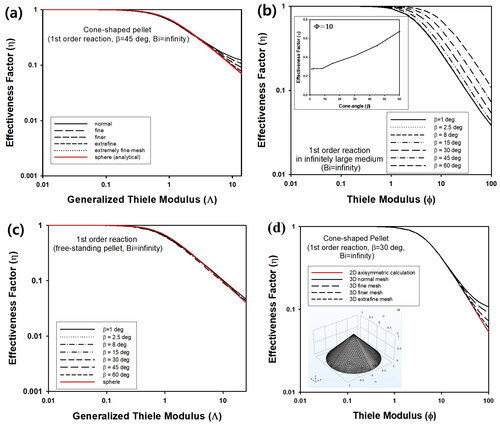
Table 1. Generalized Thiele modulus for simple, core-shell, and hollow cone-shaped pellets.
Table 2. Effectiveness factors (η) of cone-shaped catalyst (β = 15°) calculated by numerical solution of reaction-diffusion equation as a function of generalized Thiele modulus (Λ) for isothermal first-order reaction.
Figure 4. (a) Effectiveness factor (η) of cone-shaped, spherical, and cylindrical pellet. Inset graph contains transient concentration of reactant in batch reactor containing three different kinds of the pellets. All calculations were made assuming Bi → ∞. (b) Schematic figure of batch reactor or CSTR containing cone-shaped pellets (Pellet size is not to scale).
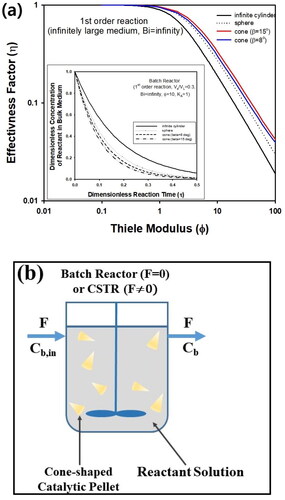
Figure 5. (a) Schematic figure of fixed bed reactor containing cone-shaped pellets (Pellet size is not to scale). (b) Transient concentration of exit stream in fixed bed reactor packed with cylindrical or cone-shaped pellets. During calculation, Vs/VL, KA, β, Dr, Φ, and Pe were fixed as 0.75, 1,15°, 1, and 10, respectively. Aspect ratio of cylindrical pellets was assumed as 1.866, which is the same as cone-shaped pellet with β = 15°.
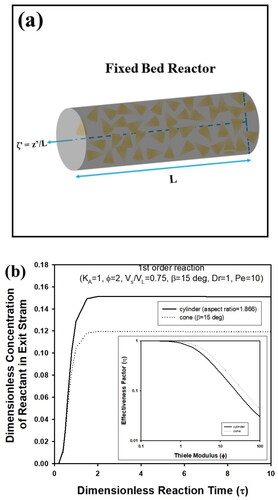
Figure 6. (a) Change of transient average intra-particle concentration of reactant inside cone-shaped pellet with β = 15° and Bi = 20 for various Φ. (b) Change of reactant concentration inside cone-shaped pellet at τ = 0, 0.01, 0.02, and 0.04. Bi and Φ were fixed as 20 and 5, respectively.
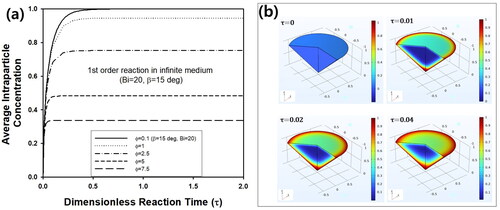
Figure 7. Change of (a) steady-state concentration (ηb) and (b) effectiveness factor (η) of core-shell cone-shaped pellet with inert core for various values of ξc. And change of (c) ηb and (d) η of hollow cone-shaped pellet for various values of ξc. For all calculations, Bi and β were ∞ and 15°, respectively. Inset graphs of (a) and (c) present ηb as a function of Λ for core-shell and hollow cone-shaped pellets, respectively. Inset graph of (b) and (d) contains steady-state concentration profile inside core-shell and hollow cone-shaped pellet, respectively, when Bi, ξc, and Φ were ∞, 0.5, and 5, respectively. (e) Transient concentration of reactant in CSTR containing hollow cone-shaped pellet with three different values of ξc. β, Vs/VL, Φ, KA, Cb0, and Ψin were 15°, 0.3, 10, 1, 0, and 10, respectively. Inset graph contains change of ηb as a function of ξc for three different values of Φ such as 1, 5, and 10.
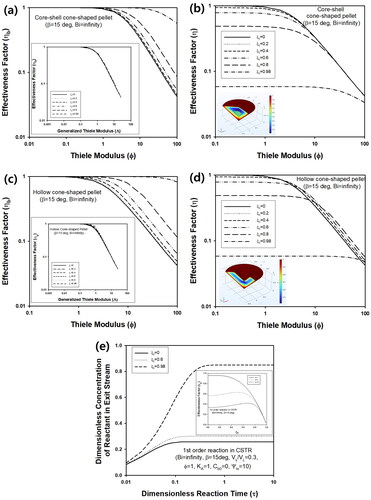
Figure 8. (a) 3D concentration profile inside cone-shaped pellet for Φ = 5. (b) Change of η of cone-shaped pellet with insulated bottom and β = 1° as a function of Φ for various values of Bi. Inset graph contains η as a function of Φ for various Bi, when β is 450. (c) Change of η as a function of Φ for various values of β, when Bi is ∞. Inset graph contains change of η as a function of β for Φ = 10. (d) Change of η as a function of generalized Thiele modulus (Λ) for various β, when Bi is ∞.
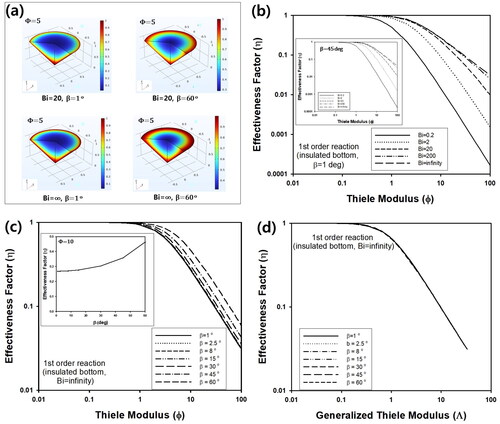
Figure 9. η of cone-shaped pellet with insulated bottom by 1D (dotted line) and 2D calculation (solid line) for Bi and β such as (a) 20 and 45° and (b) 0.2 and 45°, respectively. (c) Surface flux data by 1D approximation and 2D analysis for Bi = 20 and β = 10°. Inset graph contains surface flux for Bi = 0.2 and β = 10°.
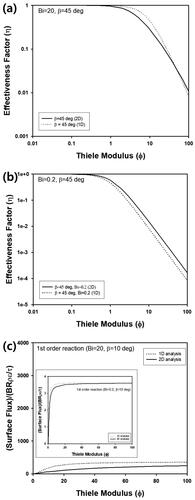
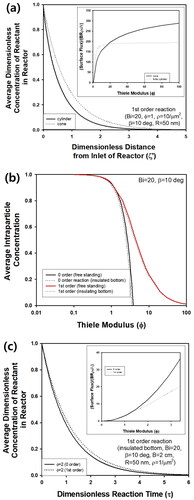
Figure 10. (a) Schematic figure of coated wall reactor with cone-shaped catalyst on substrate (Pellet size is not to scale). (b) Change of as a function of ζ’ for various values of (a) Φ, (c) ρ, and (d) β. Bi, R, and B were fixed as 20, 50 nm, and 2 cm, respectively.
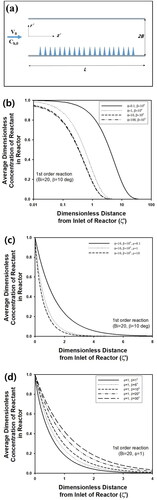
Figure 11. (a) Change of as a function of ζ′ for coated wall reactor with cylindrical and cone-shaped pellets. Bi, Φ, R, ρ, and β were 20, 1, 50 nm, 10 µm−2, and 10°, respectively. Inset graph contains surface flux from single cone and cylinder with insulated bottom, assuming 1st order reaction. (b) Change of η of cone-shaped pellet with or without insulated bottom as a function of Φ, assuming 0 (black lines) and 1st order (red lines) reaction. Bi and β were 20 and 10°, respectively. (c) Change of
as a function of ζ′ for coated wall reactor with cone-shaped pellets, assuming 0 and 1st order reaction. Bi, Φ, R, ρ, and β were 20, 1, 50 nm, 1 µm−2, and 10°, respectively. Inset graph contains surface flux data from single cone with insulated bottom, assuming 0 and 1st order reaction.