
Figures & data
Figure 1. Conceptual overview of the demand-supply model. Arrows represent flow of information for model calculation; EOL stands for end of life; and CE stands for circular economy. (1) The 7 chemicals are ethylene, propylene, butadiene, benzene, toluene, xylenes, and methanol. (2) Downstream sectors are packaging & household goods, transportation, building & construction, apparel, and other sectors. (3) CE activities include (i) elimination, (ii) reuse, (iii) substitution, and (iv) recycling. (4) Additional demand includes demand from products used in energy transition such as windmills, solar panels and batteries.
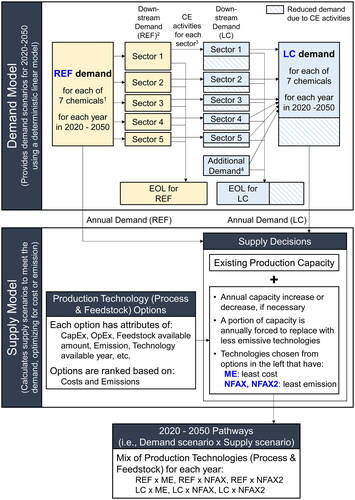
Figure 2. Demand scenarios, supply scenarios, and combined pathways.
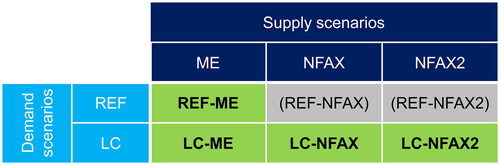
Table 1. Production technologies considered in the model, categorized by the year when they become available. (I), (T), and (E) stand for an initial, transition, and end-state technology, respectively.
Figure 3. Key process technologies and feedstock considered in the supply model. The yellow boxes represent process technologies, and the blue boxes represent key input and output from process technologies.
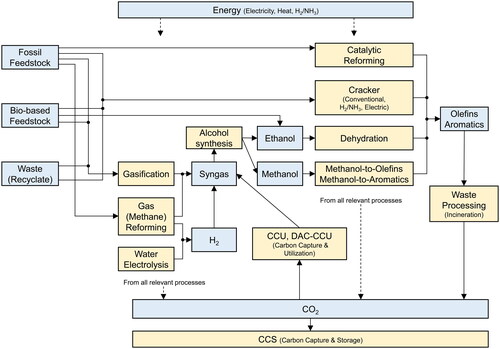
Figure 4. Changes in the demand for olefins, aromatics, and methanol between 2020 and 2050 in Japan. White type indicates the total demand for olefins and aromatics only.
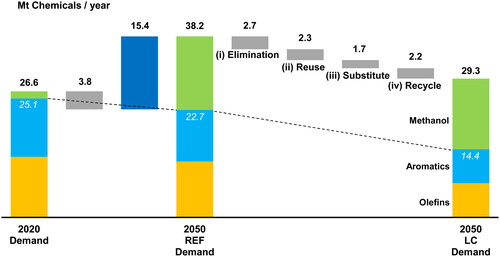
Figure 5. (a). Sources of carbon in the feedstocks for different pathways, for the seven chemicals in the scope of this study.
(b). Emissions in 2050 for different pathways, and the amount of CCS assumed in each pathway.
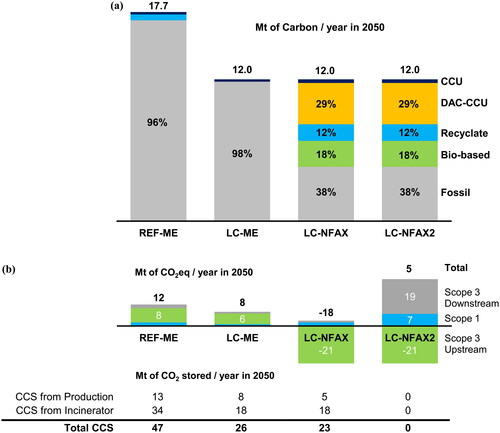
Figure 6. Breakdown of production technologies to produce olefins, aromatics, and methanol for different pathways.
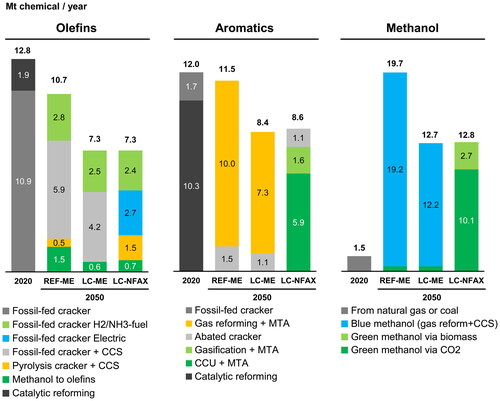
Figure 7. (a). Cumulative capital expenditures until 2050, broken down by target products.
(b). Unit production cost of chemicals in net zero pathways in 2050.
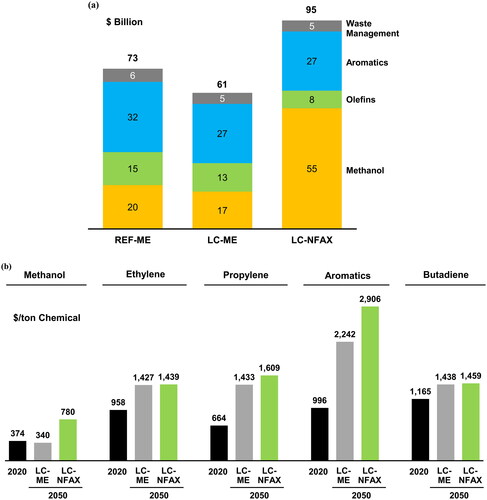
Figure 8. Conceptual positioning and carbon vector of where we are today, the four net zero pathways, and the target zone of net zero, with respect to two GHG reduction measures.
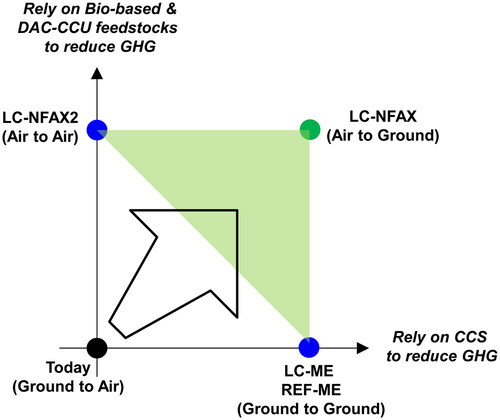
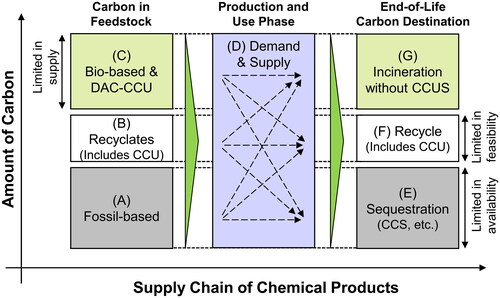
Figure 9. Carbon balance in the chemical supply chain. Carbon balance and scope 3 (category 12) net zero together require (A)=(E), (B)=(F), and (C)=(G). As long as these equations hold true, fossil feedstock, for example, can reach any of the three destinations to be scope 3 (category 12) net zero, as indicated by the dotted arrows in the Production and Use Phase. These equations also indicate (D)=(C)+(E)+(F), strategic implications of which are detailed in the Discussion section. The proportion of (A):(B):(C) or (E):(F):(G) is for illustrative purposes only.
Data availability statement
Detailed assumptions for the demand and supply model and the Python program for the model can be found on our GitHub site (https://github.com/systemiqofficial/Pathways-Chemical-Industry-Japan).