
Figures & data
Map 1. Pilot households and comparison households.
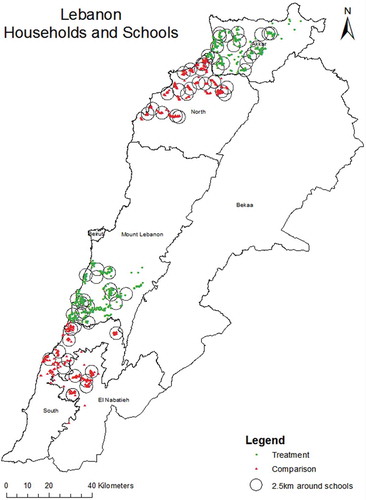
Table 1. Household demographic and composition characteristics at baseline
Table 2. Adults ages 17+: demographic characteristics at baseline
Table 3. Housing quality and access to basic services at baseline
Table 4. Household economic well-being and exposure to aid at baseline
Table 5. Children ages 5–14: demographic characteristics, education, and time use at baseline
Figure 1. Baseline balance.
Notes: The horizontal axis represents distance (in kilometres) to the border separating the pilot governorates (Akkar and Mount Lebanon) from the comparison governorates (North, South, and Nabatieh). The vertical red line represents the border. The vertical axis measures the outcome variable of interest. Dots represent local averages, scaled by the number of households. Linear ordinary least squares regression lines have been fitted to the left and the right of the border. Grey areas represent the 95 per cent confidence interval around the regression line.
*Panels c and d represent data conditional on enrolment in an afternoon shift. Observations, panels a and b: 2,767. Observations, panels c and d: 940.
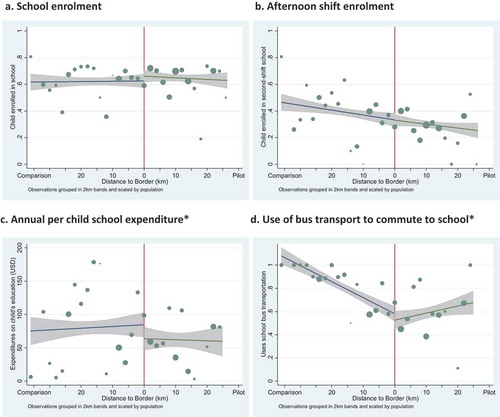
Table 6. Regression results
Figure 2. End line school enrolment.
Notes: The horizontal axis represents distance (in kilometres) to the border separating the pilot governorates (Akkar and Mount Lebanon) from the comparison governorates (North, South, and Nabatieh). The vertical red line represents the border. The vertical axis measures the outcome variable of interest. Dots represent local averages, scaled by the number of households. Linear ordinary least squares regression lines have been fitted to the left and the right of the border. Grey areas represent the 95 per cent confidence interval around the regression line. Observations: 2,767.
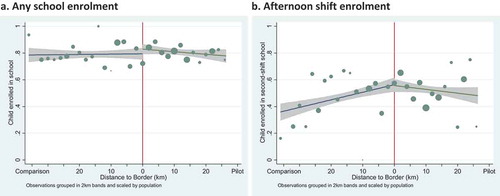
Figure 3. End line NLG/Min Ila Programme beneficiary households.
Source: Calculated based on administrative data.
Notes: The horizontal axis represents distance (in kilometres) to the border separating the pilot governorates (Akkar and Mount Lebanon) from the comparison governorates (North, South, and Nabatieh). The vertical red line represents the border. The vertical axis measures enrolment in the NLG/Min Ila Programme at follow-up. Dots represent local averages, scaled by the number of households. Linear ordinary least squares regression lines have been fitted to the left and the right of the border. Grey areas represent the 95 per cent confidence interval around the regression line. Observations: 2,767.
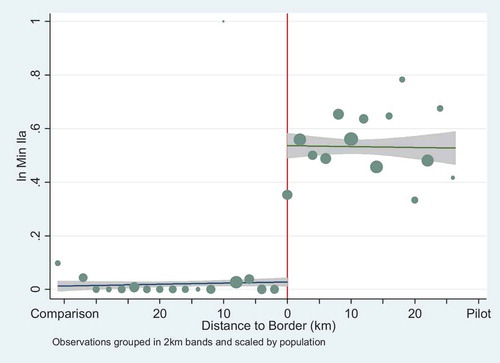
Figure 4. End line education outcomes, conditional on enrolment in an afternoon shift.
Notes: The horizontal axis represents distance (in kilometres) to the border separating the pilot governorates (Akkar and Mount Lebanon) from the comparison governorates (North, South, and Nabatieh). The vertical red line represents the border. The vertical axis measures the outcome of interest. Dots represent local averages for clusters of households, scaled by the number of households. Linear ordinary least squares regression lines have been fitted left and right of the border. Grey areas represent the 95 per cent confidence interval around the regression line. In panel a, 28 observations with values above US$400 were dropped for ease of comprehension. Observations, panel a: 1,364. Observations, panels b and c: 1,392.
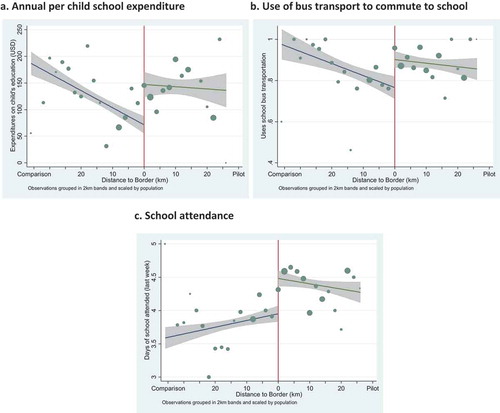
Figure A1. Attrition of children ages 5–14 from baseline to follow-up.
Notes: The horizontal axis represents distance (in kilometres) to the border separating the pilot governorates (Akkar and Mount Lebanon) from the comparison governorates (North, South, and Nabatieh). The vertical red line represents the border. The vertical axis measures the percentage of households that remain in the sample at follow-up. Dots represent local averages, scaled by the number of households. Linear ordinary least squares regression lines have been fitted to the left and the right of the border. Grey areas represent the 95 per cent confidence interval around the regression line. Observations: 2,897.
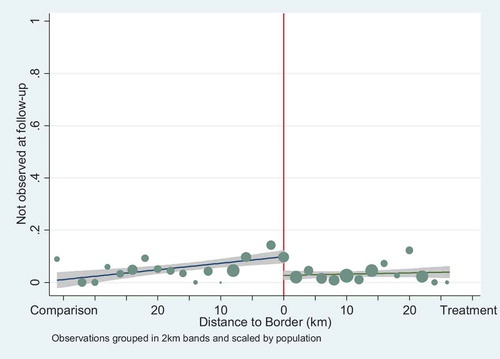
Table C1. Robustness tests