Figures & data
Figure 1. Distribution and determinants of under-5 wasting in 16 Sub-Saharan African countries. (a) Distribution of weight-for-height (WHZ) score among under-5 children of rural DHS respondents. (b) OLS regression coefficients of determinants of under-5 WHZ score with whiskers representing 95 per cent confidence intervals. The horizontal axis is expressed as per cent of a standard-deviation change in WHZ score with a one-unit increase in the independent variable (N = 138,103).
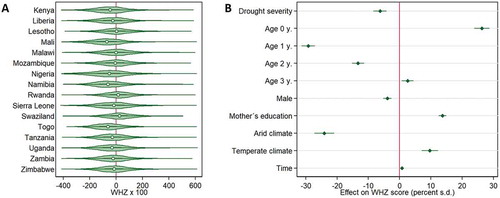
Table 1. Aid and under-5 WHZ score under various climatic conditions
Table 2. Interaction effect of aid and drought severity on under-5 WHZ score
Figure 2. Aid treatment, drought exposure, and under-5 undernutrition. (a) Spatial distribution of development aid project sites, observed 1–4 years prior to the DHS survey. (b) spatial extent of SPEI-12 drought, averaged over the same grid, observed during the last 12 months prior to the DHS survey (‘normal or wet conditions’ refer to SPEI score > −0.5; ‘mild drought’ > −1; ‘moderate drought’ > −1.5; ‘severe drought’ > −2; ‘extreme drought’ ≤ −2). (c) Grid-cell average extent of under-5 wasting, derived from the DHS survey (‘very low’ denotes WHZ × 100 score ≥ 0; ‘low’ > −50; ‘medium’ > −100; ‘high’ > −180; ‘very high’ ≤ −180). Colour scales are smoothed to facilitate visual interpretation. Grey areas are not covered by the study.
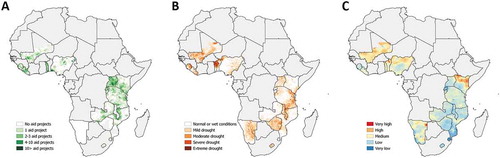
Figure 3. Effect of aid on under-5 wasting for matched respondents. The plots show OLS regression coefficients with whiskers representing 95 per cent confidence intervals, expressed as per cent of a one standard-deviation change in WHZ score from aid intervention, under drought and normal climatic conditions. (a) All aid projects (Model 2 vs. 3); (b) agricultural aid projects (Model 5 vs. 6).
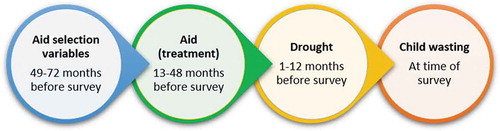
Figure A1. Sequencing of variable measurements.