
Figures & data
Table 1. Determinants of access to natural resource revenue information
Figure 1. Main media information sources for what happens in Ghana (Panel A) and in the respondent’s own area (Panel B) in general and for information about how natural resource revenues are handled in Ghana (NRRM, Panel C) and in the respondent’s own area (LRRM, Panel D) in per cent.
Notes: As all respondents could list two main information sources, the per cent shares add up to 200%. UC: Unit Committee; DA: District Assembly. Original data with further breakdown can be found in Supplementary Appendix, SA Tables 1 and 2.
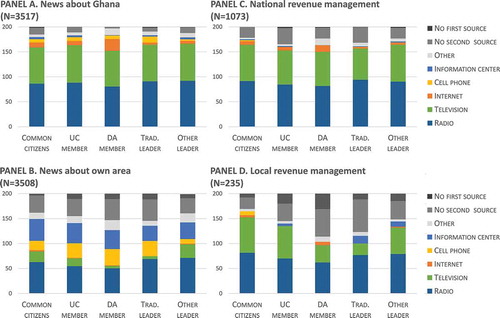
Figure 2. Main personal information sources for what happens in Ghana (Panel A) and in the respondent’s own area (Panel B) in general and for information about how natural resource revenues are handled in Ghana (NRRM, Panel C) and in the respondent’s own area (LRRM, Panel D) in per cent.
Notes: As all respondents could list two main information sources, the per cent shares add up to 200%. UC: Unit Committee; DA: District Assembly. Original data with further breakdown can be found in Supplementary Appendix, SA Tables 1 and 2.
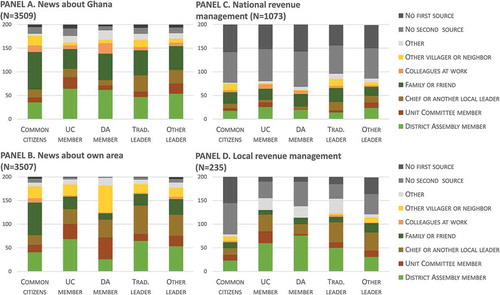
Figure 3. Most and least trusted media (Panels A and C) and personal (Panels B and D) information sources in per cent.
Notes: As all respondents could list two main information sources, the per cent shares add up to 200%. UC: Unit Committee; DA: District Assembly. Original data with further breakdown can be found in Supplementary Appendix, SA Table 5.
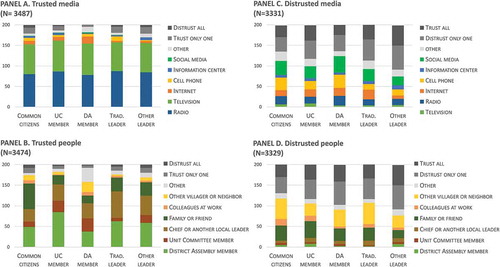
Table 2. Characteristics of informed citizens, national resource revenue management
Table 3. Characteristics of informed citizens, local resource revenue management