
Figures & data
Table 1. Number and proportion of firms with a domestic and/or an international certificate (2015)
Table 2. Number and proportion of firms with a domestic and/or an international certificate by province and sector (2015)
Table 3. Variables definitions and summary statistics
Table 4. Determinants of domestic certification: marginal effects
Table 5. Sales growth: main drivers
Table 6. The effect of domestic certificates on sales growth: different samples
Figure 1. Balance box plot: domestic certificate
Notes: The plot has been obtained by implementing one-to-three nearest neighbour.
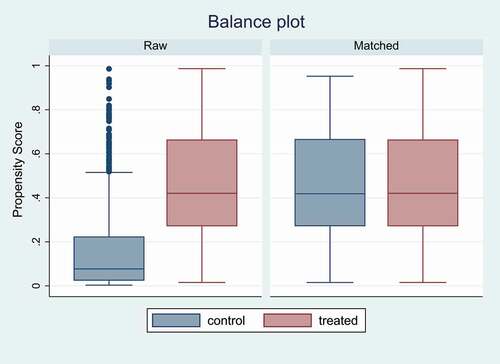
Table 7. Average treatment effect on the treated (ATET)
Supplemental material