
Figures & data
Figure 1. Bangalore has 15 town areas which served as the first stage sampling frame in the multistage sampling strategy utilised for the analysis. The purple (starred) and green (drop shaped) pins in the map (generated using Google My Maps application) indicate the 5 town areas randomly selected in Round 1 and Round 2 respectively. In the second stage 2 slums each were selected randomly from each of the 5 town areas, leading to 10 (non-overlapping) slums being surveyed in each round
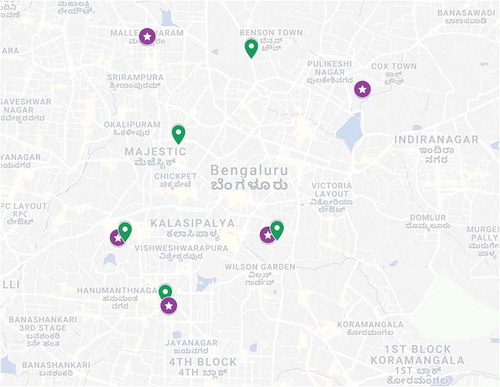
Table 1. Mean self-assessments on ‘language skills’ and ‘task skills’ in Round 2, disaggregated by gender are presented. While conversational Kannada skills are common in the sample, written Kannada skills are less prevalent. On the other hand written English skills are rated higher by the mean respondent compared to spoken English skills. Significant gender disparities in self-assessment exist in favour of male respondents in all but language skills. Larger and significant gender disparity are observed in most task skills, particularly those related to bike and car driving, traffic rules and geographic knowledge, as well as skills like (use of) banking services, internet and mobile phone usage
Table 2. Mean self-assessments on ‘personal skills’ and ‘social skills’ in Round 2, disaggregated by gender are presented. In comparison to language and task skills, the gender disparity in self-assessments on these soft skills is somewhat less, with no significant difference in means for a number of skills. However, whenever there is a significant difference in mean self-assessments, it is in favour of male respondents. The only exception to this is the social skill of ‘Caring for others’, highlighted in bold. The few social skills where not all respondents rated themselves highly were ‘Management of team’, ‘Customer service’, ‘Supervising’ and ‘Teamwork’. Among personal skills, ‘Creativity’, ‘Dressing sense’ and ‘Confidence’ had the lowest mean self-assessments among all respondents
Table 3. Mean self-assessments on specialised skills in Round 2, disaggregated by gender are presented. We note that mean self-assessments by females is significantly higher than males for a number of skills, highlighted in bold, which exhibits the phenomenon of gender specialisation of occupations and skills. The only specialised skills which did not have significant gender differences are ‘Designing skills’, ‘Sales’ and ‘Packing’
Figure 2. Mean self-assessments of respondents on the set of language, task, personal and social skills from Round 1 dis-aggregated by gender (along with 95 % error bars) are presented in (a) and (b) respectively. While there was clear gender disparity in self-assessment of language and task skills with female mean assessments being significantly lower than males, this was not the case when it came to questions about personal and social skills, where most respondents rated themselves very highly irrespective of gender. Correlation plots between these skill claims (along with a dummy variable for females) are presented in (c) and (d)
Table 4. The 7 optimal clusters obtained by the k-means algorithm, in increasing order of number of skills per cluster. The skills contained in Cluster B are all associated with domestic work and no basic skills are associated with this cluster – confirming anecdotal evidence that such work is carried out by the most vulnerable (typically female) population. Cluster C points towards respondents employed in the IT sector. This cluster also contains the important skills of ‘bank work’ as well as English reading, writing and listening. Native Bangaloreans are more likely to be employed in this sector implied by the presence of Kannada reading and writing skills in this cluster
Figure 3. Hyperbolic embedding of skills presented here provides both a hierarchy of skills along with their co-occurence. Our embedding, disaggregated by (a) language and task, (b) personal and social (c) specialised skills reveals a high concentration near the centre of the embedding, which suggests that there may be underlying sub-skills transferable across a number of specialised skills. Basic language and task skills are more spread out in the embedding – implying that the distribution of these skills is clustered and uneven across our sample
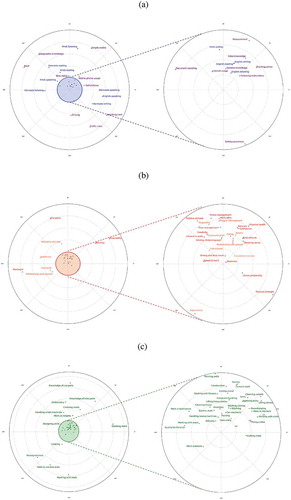
Table 5. Results of the outcome equation of the Mincerian wage equation conditional on being employed (1) from different specifications using the Round 1 data
Table 6. Results of the estimation on whether the respondent receives regular monthly wages conditional on being employed (2) using Round 1 data. For ease of interpretation, the odds ratio transformations of the coefficient estimates are presented in this table
Table 7. Results of the estimation on whether the respondent is currently employed (2) using Round 1 data. For ease of interpretation, the odds ratio transformations of the coefficient estimates are presented in this table
Table 8. Variables selected by LASSO regression (along with estimated coefficient values) in a supervised learning problem using Round 2 data where the outcome of interest is log wages conditional on being employed. Variables are presented in ascending order of coefficient estimates
Table 9. Variables selected by LASSO regression (along with odds ratio transformations of estimated coefficients) in a supervised learning problem using Round 2 data where the outcome of interest is receipt of regular monthly wages conditional on being employed. Variables are presented in ascending order of coefficient estimates