
Figures & data
Figure 1. Timeline of the project. Source: JICA (Citation2014).
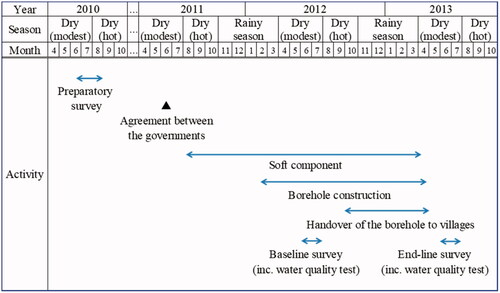
Figure 2. Procedure of site selection and sampling. Source: JICA (Citation2014).
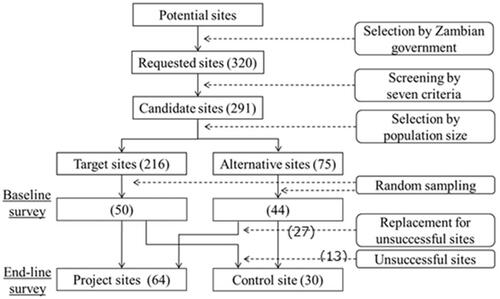
Table 1. The main outcome variables (baseline)
Table 2. Impact on fetching water (household level)
Table 3. Impact on incidence of diarrhea symptoms
Table 4. Impact on school attendance and time spent on schooling and homework
Table 5. Impact on time spent on fetching water and washing/cleaning/cooking
Table 6. Impact on time spent by female adults
Table B1. Number of households in each district
Table B2. Summary statistics
Supplemental material