
Figures & data
Figure 1. Risk of first violence, by years in marriage.
Note: The hazard rates show the number of women who experience violence for the first time in a given marriage year, divided by the number of women at risk in that marriage year.
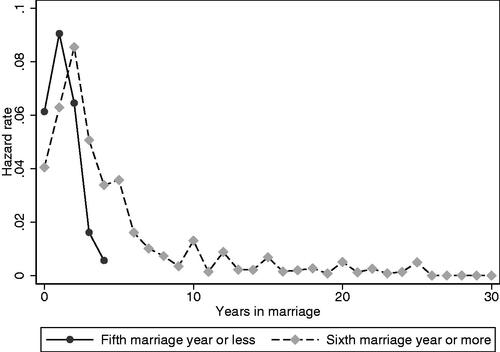
Table 1. Summary statistics, MGNREGA
Figure 2. Annual changes in the number of MGNREGA workers, log-points.
Notes: The figure shows a whisker plot of annual log-point changes in the number of MGNREGA workers, based on the 2259 blocks in our estimation sample. The vertical boxes denote the 25th (lower hinge) and the 75th percentile (upper hinge).
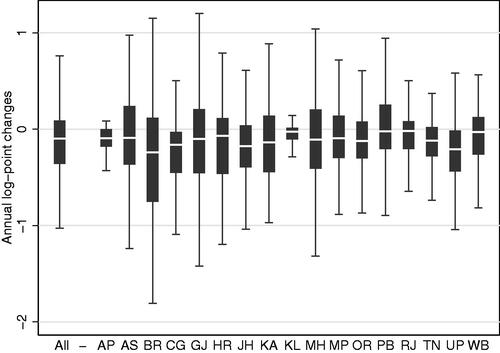
Table 2. Relationship between MGNREGA, droughts, and night-time light
Table 3. Impact of MGNREGA on intimate partner violence
Table 4. Placebo and alternative time trends
Table 5. Impact of gender-specific MGNREGA on intimate partner violence
Table 6. Heterogeneity of MGNREGA effect by female labour force participation (LFP)
Table A1. Impact of MGNREGA on intimate partner violence, controlling for time-varying variables
Table A2. Heterogeneity of MGNREGA effect by past female labour force participation (LFP)