
Figures & data
Figure 1. Path diagram of the model.
Notes: The measurement models are the dashed rectangles; the structural model is the solid rectangle. Latent variables are shown as ellipses; observed variables are presented by rectangles. The arrows represent hypothesised direct effect.
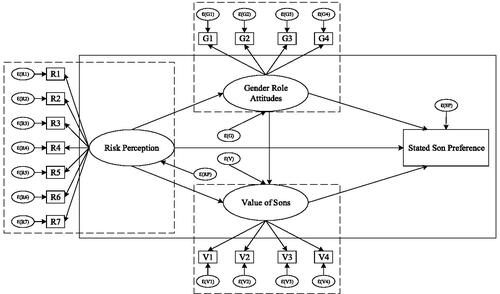
Table 1. Constructs, survey items, and standardised factor loadings
Table 2. Estimation results of the structural model
Table 3. Bootstrapping indirect effects of gender role attitudes and value of sons
Table A1. Descriptive statistics (N = 1032)
Table B1. Estimation results of the structural model: Risk perception related to male marriage squeeze
Table B2. Bootstrapping indirect effects of gender role attitudes and value of sons: risk perception related to male marriage squeeze
Table B3. Estimation results of the structural model: Risk perception related to female safety issues
Table B4. Bootstrapping indirect effects of gender role attitudes and value of sons: risk perception related to female safety issues
Table B5. Selection on unobservables
Data availability statement
The data and codes are available upon request.