
Figures & data
Figure 1. Timeline of crisis and data rounds.
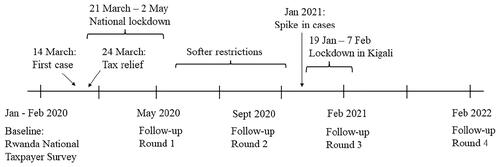
Figure 2. Shifts in attitudes and perceptions. Notes: results based on Rwanda National Taxpayer Survey. Graphs show coefficients on round1, round2 and round3 (see EquationEquation (1)(1)
(1) ) from fixed effects regressions on the relevant outcome, indicated at the top of each graph.
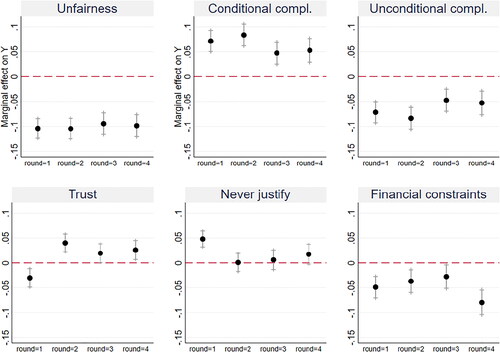
Table 1. Impact of the crisis on firms and policy response
Figure A1. Confirmed cases of COVID-19 per million people in Rwanda. Source: Our world in data 2021.
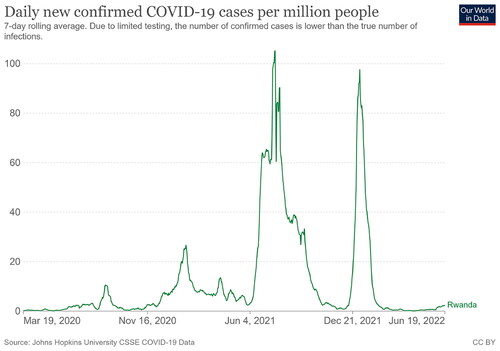
Figure A2. Stringency index in Rwanda. Source: Our world in data 2021.
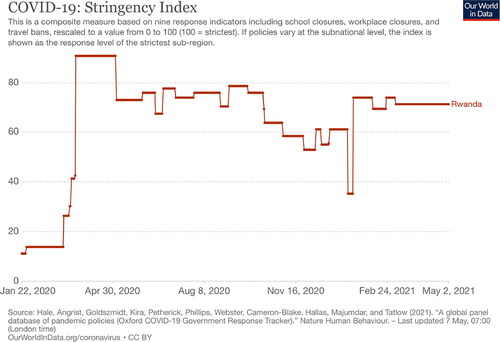
Figure A3. Shifts in in attitudes and perceptions: by tax relief access status. (a) Accessed tax relief. (b) Did not accessed tax relief.
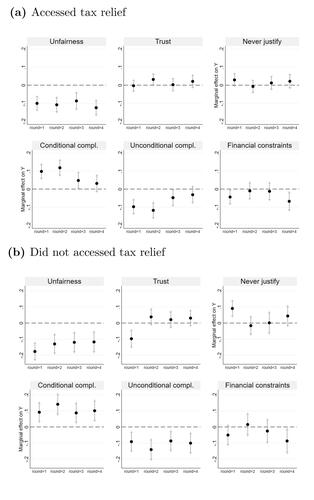
Figure A4. Shifts in in attitudes and perceptions: by business closure due to pandemic. (a) Business closed due to pandemic. (b) Business did not close due to pandemic.
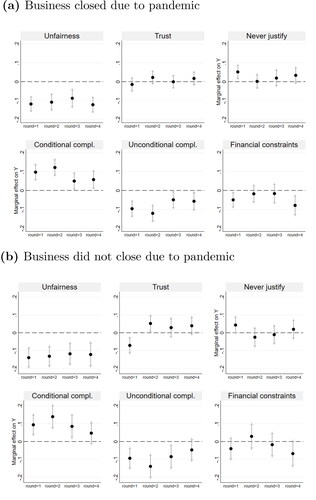
Figure A5. Change in solidarity one year after COVID-19 outbreak. Notes: results based on data from the Rwanda National Taxpayer Survey. Survey question reads: comparing the period before COVID and today, would you say that people are now: More likely to help each other/Less likely to help each other/About the same.
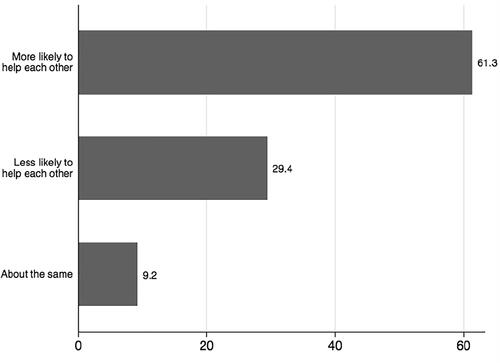
Figure A6. Change in patriotism one year after COVID-19 outbreak. Notes: results based on data from the Rwanda National Taxpayer Survey. Survey question reads: comparing the period before COVID and today, would you say that people are now: More proud to be Rwandan/Less proud to be Rwandan/About the same.
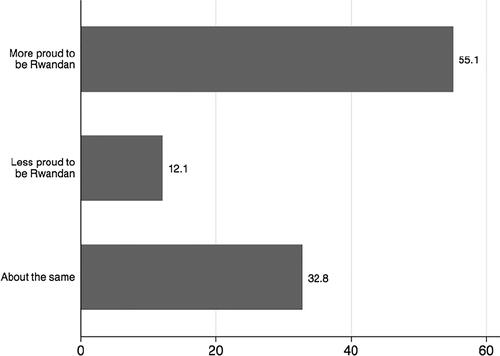
Table A1. Variables description
Table A2. Changes in tax attitudes over time, fixed effects estimation