Figures & data
Figure 1. Stylised education production function following Glewwe and Kremer (Citation2006). Authors’ own representation.
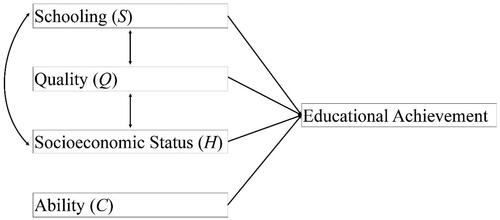
Figure 2. Data availability for ABCC calculations (a) and height measures (b). Authors’ own representation.
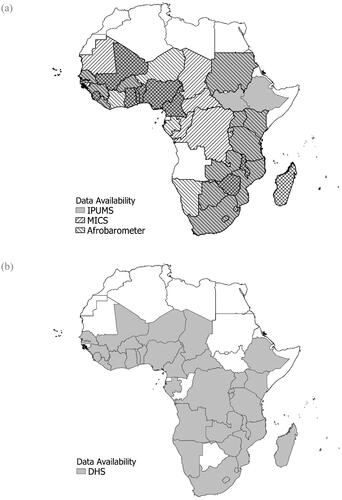
Figure A.1. Relationship of average years of schooling and numeracy (ABCC Index). Data from IPUMS, MICS and Afrobarometer. Authors’ own representation.
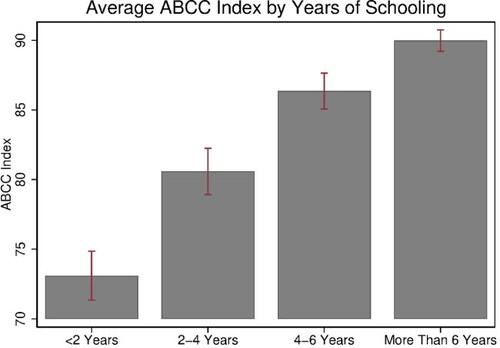
Figure 3. ABCC Index per admin I level for each birth decade between 1950 and 1990. Data from IPUMS, MICS and Afrobarometer. Authors’ own representation.
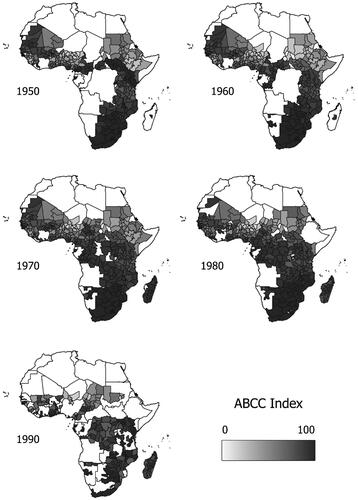
Figure 4. Schooling efficiency per admin I level for each birth decade between 1950 and 1990. Data from IPUMS, MICS, Afrobarometer and DHS. Authors’ own representation.
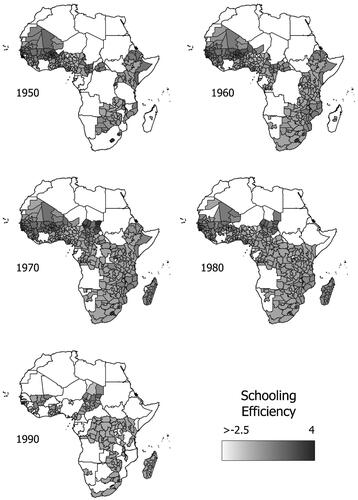
Table 1. Baseline regression – correlation of schooling efficiency and height
Table 2. Instrumental variable regression – the impact of nutrition on schooling efficiency
Table 3. Robustness checks – exclusion of the low or high extreme rain values and by rural/urban areas
Table A.1. Data set construction overview
Table A.2. Geographic control variables
Table A.3. Summary statistics
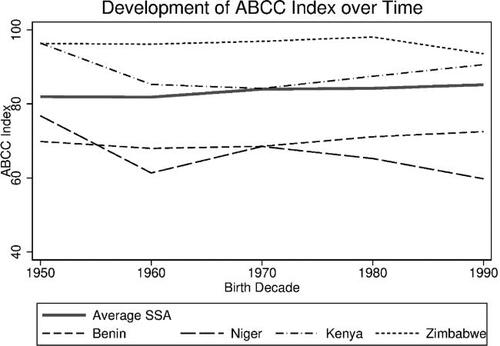
Figure A.2. Development of numeracy over time for selected countries – Benin, Niger, Kenya, and Zimbabwe. The average refers to all Sub-Saharan African countries included in the data set. Source: IPUMS, MICS and Afrobarometer. Authors’ own representation.