
Figures & data
Figure 1. The submission rates for assignments in each week for each condition.
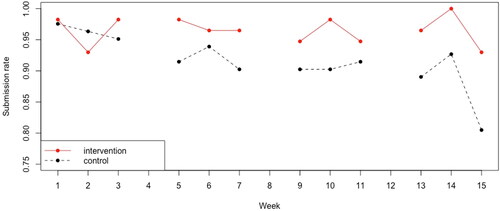
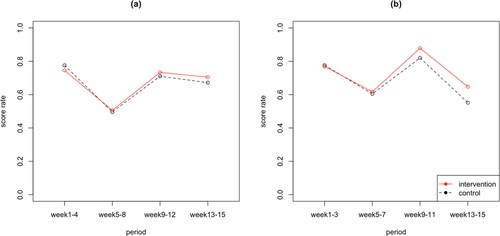
Figure 2. The mean score rates for assignments in each period for each condition. The mean scores for the surface processing tasks were presented in the panel (a), and those for the deep processing tasks were presented in the panel (b).
Supplemental material
Supplemental Material
Download MS Word (23.4 KB)Data availability statement
The datasets generated and analyzed during the current study are available from the corresponding author on reasonable request.