
Figures & data
Table 1. Characteristics of two case study sections of geography of North America.
Figure 1. Fourteen North America Sub-Region Virtual Field Trips in Google Earth with the point locations of each stop included in each virtual tour, which include a mix of both physical geography and human geography examples in each sub-region. The fourteen sub-regions are based on the delineation from the textbook used in this course: Hardwick, Susan Wiley, Fred M. Shelley, and Donald G. Holtgrieve. 2013. The Geography of North America: Environment, Culture, Economy. Boston: Pearson. Map data: Google, Data SIO, NOAA, U.S. Navy, NGA, GEBCO Landsat / Copernicus, IBCAO, U.S. Geological Survey, INEGI.
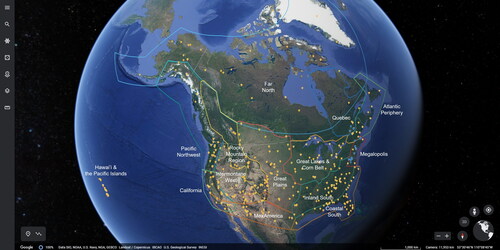
Figure 2. Physical geography examples from the Inland South virtual field trip in Google Earth. Clockwise from top right: 3D view of Brasstown Bald (4,784 ft.), highest point in Georgia; Google street view from summit of Brasstown Bald; Google street view from summit of Mt. Mitchell; 3D view of Mt. Mitchell (6,684 ft.), highest point in North Carolina and highest point in the U.S. east of the Mississippi River. Map data: Google, Landsat / Copernicus, Data SIO, NOAA, U.S. Navy, NGA, GEBCO.
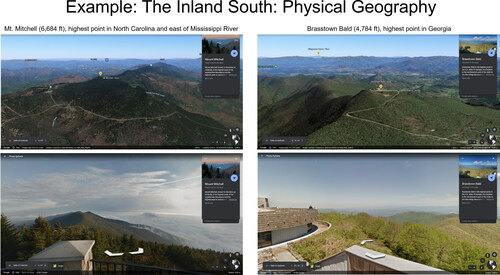
Figure 3. Urban geography examples of Atlanta, Georgia, from the Inland South sub-region virtual field trip in Google Earth. Clockwise from top right: Google street view of Peachtree Street in downtown central business district of Atlanta, Georgia; Google street view of intersection of Tenth Street NE and Piedmont Avenue NE in Midtown Atlanta, Georgia; 3D view of Atlanta skyline as seen from the southeast looking northwest toward Kennesaw Mountain; 2D view of Atlanta metro area. Map data: Google, Landsat / Copernicus, Data SIO, NOAA, U.S. Navy, NGA, GEBCO.
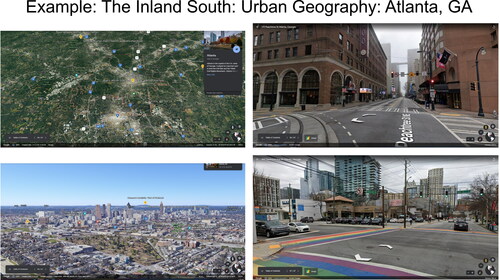
Table 2. Geography of North America project topics completed by students.
Table 3. Characteristics of survey participants in two case study geography of North America course sections.
Table 4. Results from survey Likert scale items.
Table 5. Example of Google Earth Project Grading Rubric.