
Figures & data
Table 1. Number and percent of nonexempt students, by reason for nonexemption
Table 2. Mean (and standard deviation) of student background characteristics, by exempt status and policy status
Figure 1. Compliance with assignment to treatment based on the relationship between PERT scores (centered around the cutoff for assignment to developmental education) and enrollment in any developmental course (upper-level cutoff) and enrollment in a lower-level developmental course (lower-level cutoff)
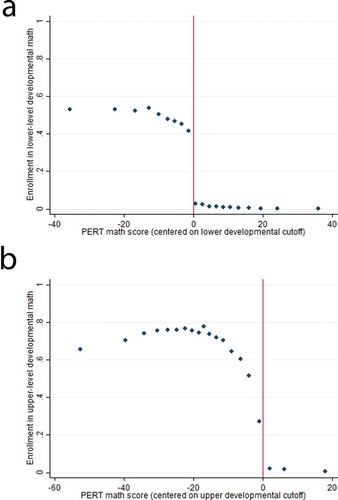
Figure 2. Density plot of the running variable, PERT math scores
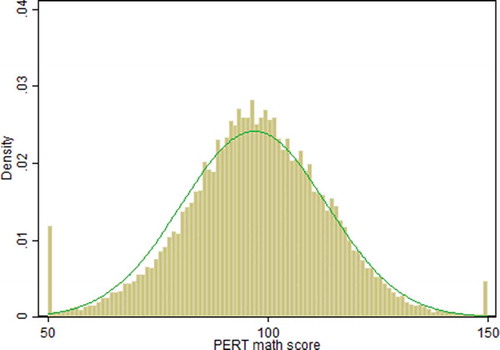
Table 3. Baseline equivalence on student background characteristics for students above and below the cutoffs for assignment to lower-level developmental education and upper-level developmental education
Figure 3. Scatterplots of the relationship between the outcome variables and the running variable (PERT math scores). Solid lines indicate the cut scores for assignment to lower- and upper-level developmental education
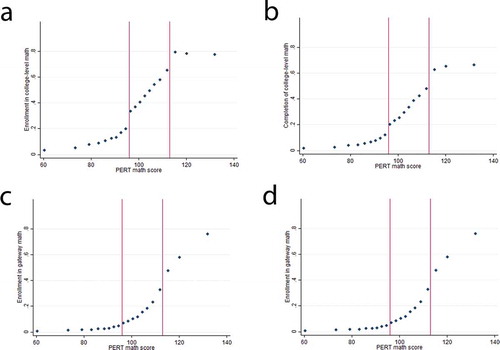
Table 4. Impact of assignment to upper DE (relative to college-level) on first-year coursetaking outcomes for nonexempt students
Table 5. Predicted probabilities for first-year math coursetaking outcomes for students assigned to upper DE relative to college-level math
Table 6. Impact of assignment to lower DE (relative to upper DE) on first-year coursetaking outcomes for nonexempt students
Table 7. Predicted probabilities for first-year math coursetaking outcomes for students assigned to lower DE relative to upper DE math
Table A1. Sensitivity analyses with alternate bandwidths and functional forms for impact of assignment to upper DE (relative to college-level) on enrollment and completion of Intermediate Algebra (or higher) for nonexempt students
Table A2. Sensitivity analyses with alternate bandwidths and functional forms for the impact of assignment to upper DE (relative to college-level) on enrollment and completion of gateway math (or higher) for nonexempt students
Table A3. Sensitivity analyses with alternate bandwidths and functional forms for the impact of assignment to lower DE (relative to upper DE) on enrollment and completion of Intermediate Algebra (or higher) for nonexempt students
Table A4. Sensitivity analyses with alternate bandwidths and functional forms for the impact of assignment to lower DE (relative to upper DE) on enrollment and completion of gateway math (or higher) for nonexempt students
Table A5. Sensitivity analyses with interaction terms for the impact of assignment to upper DE (relative to college-level) on enrollment and completion of Intermediate Algebra (or higher) for nonexempt students
Table A6. Sensitivity analyses with interaction terms for the impact of assignment to upper DE (relative to college-level) on enrollment and completion of gateway math (or higher) for nonexempt students
Table A7. Sensitivity analyses with interaction terms for the impact of assignment to lower DE (relative to upper DE) on enrollment and completion of Intermediate Algebra (or higher) for nonexempt students
Table A8. Sensitivity analyses with interaction terms for the impact of assignment to lower DE (relative to upper DE) on enrollment and completion of gateway math (or higher) for nonexempt students