
Figures & data
Table 1. Exclusion and Inclusion Criteria Traced from Initial to Final Sample.
Table 2. Coding Sheet for Each Effect per Article.
Figure 1. Funnel plot with Egger’s regression line.
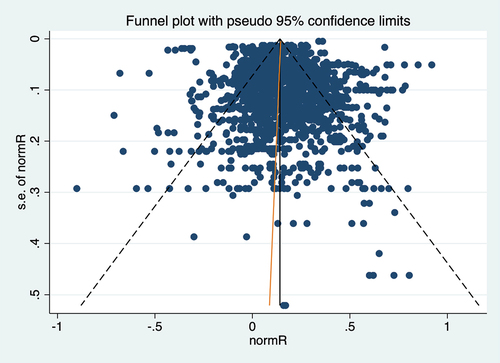
Figure 2. Predictive Value of the GRE Over Time, Effects Across Studies.
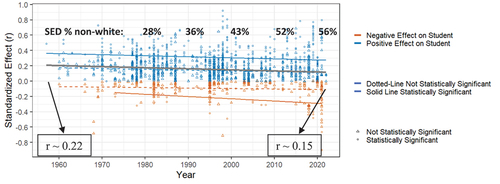
Figure 3. Predictive Value of the GRE Across Gender, Effects Across Studies.
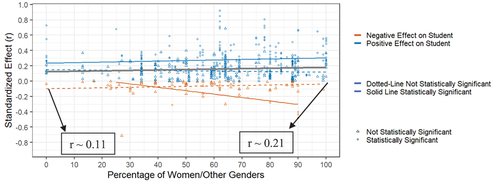
Figure 4. Predictive Value of the GRE Across racially minoritized, Effects Across Studies.
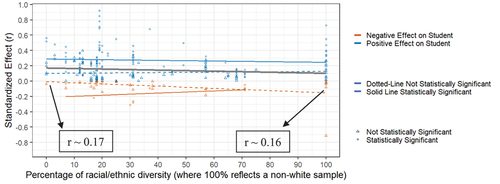
Table 3. Disciplinary Impact on the Predictive Validity of the GRE.
Table 4. Differences in the Predictive Validity across GRE Subsections.
Table 5. Differences in the Predictive Validity across Different Student Outcomes.
Figure 5. Predictive Value of the GRE on GPA Over Time, Effects Across Studies.
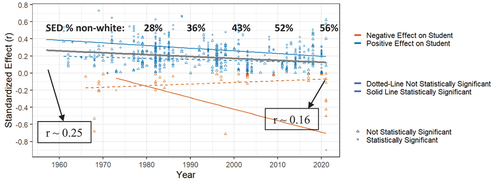
Figure 6. Predictive Value of the GRE on GPA Across Gender, Effects Across Studies.
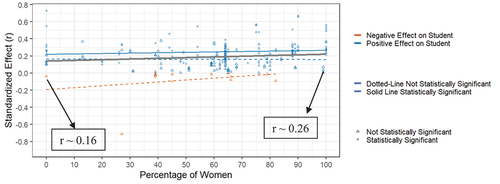
Figure 7. Predictive Value of the GRE on GPA Across Race, Effects Across Studies.
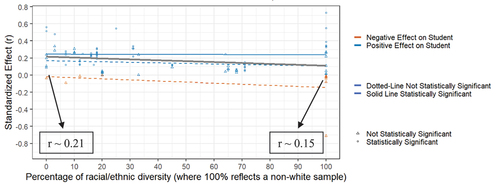
Table 6. Differences in the Predictive Validity of the GRE on GPA across Disciplines.
Table 7. Differences in the Predictive Validity of the GRE on GPA across GRE Subsections.