Figures & data
Figure 1 Screen of upward inclined water jets as technical measure to control turbidity currents and location of sediment deposits in reservoir
Figure 2 Schematic view of experimental installation with 
 constant head stilling box with gate and tranquilizer outlet,
  mixing tank and
  outlet tank with sediment filter

Figure 3 (a) Flume inlet with tranquilizer box, (b) water jet injection apparatus, (c) UVP transducer, bottom (small dots) and longitudinal reference electrodes for sediment layer thickness measurements
Table 1 Experimental parameters of turbidity currents influenced by inclined jet screen (series E) and for comparison with Test A06 involving comparable initial conditions than Test E01, h 0 is equal to gate opening of 4.5 cm
Table 2 Test parameters of inclined jet diffuser
Table 3 Characteristics of inclined jet screen related to approach flow turbidity currents
Figure 4 Locations of five velocity profiles taken using UVP transducers, with dimensions in (m)
Figure 5 Physical modelling of turbidity current flowing down incline of S o = 4.64%, passing through 45° upward inclined water jet screen, at t = 140 s (Test E01, see also ), resulting in a bore propagating upstream
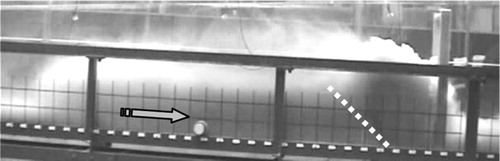
Figure 6 Sequence of turbidity current flowing through inclined jet screen, time intervals 10 s, Test E04
Figure 7 Vertical velocity profiles of turbidity current for Test A06 (a)–(f), continuous turbidity current without obstacle and Test E01 (g)–(k), with jet screen at x = 515 cm
Figure 8 Evolution of non-dimensional turbidity current (□) velocity U/U 0 and (Δ) height h/h 0 along flume up- and downstream of jet screen for E series. For comparison, the values for Test A06 are also shown. Lines for E series represent average of all height and velocity data, respectively
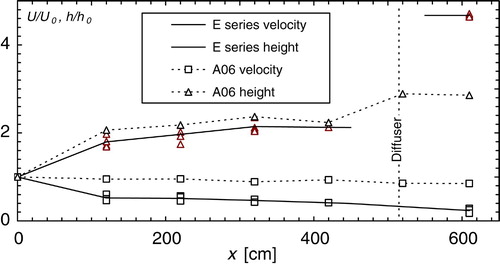
Figure 9 Measured turbidity current front positions of series E with jet screen at x = 515 cm. Test E01 had a clearly defined reflection bore, Test E02 was completely blocked by jet screen, Tests E03 and E04 went through the screen with a slight decrease in velocity
Figure 10 Measured evolution of sediment deposit of turbidity current partially blocked by 45° upward inclined water jet screen, Test (a) E01 and (b) E03. Note the considerable reduction of downstream sediment deposit depth d b (in log scale)
Figure 11 Comparison of ratios q s /q s0 for (a) Test E01 with a sloping bottom and (b) Test E03 with a horizontal bottom