Figures & data
Figure 1 Dimensions (in m) of the experimental set-up: (a) side view, (b) plan view
Figure 2 Schematic cross-section dimensions of the intermediate dam (unit: m)
Figure 3 Front view showing the locations of pressure sensors on the downstream dam (unit: m)
Figure 4 Time evolution of pressure loads from all four pressure sensors for three repeated tests and the mean (D = 0.40 m, hu = 0.30 m, h = 0.40 m, hd = 0.30 m): (a) P1, (b) P2, (c) P3, (d) P4
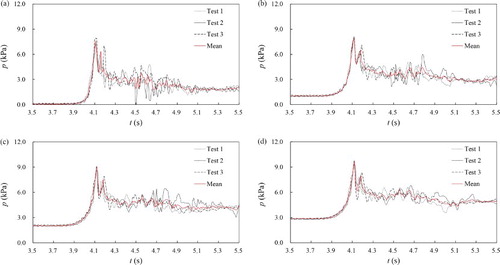
Table 1 Experimental scenarios with different heights of intermediate dam and initial water depths
Figure 5 Snapshots of the leap pattern
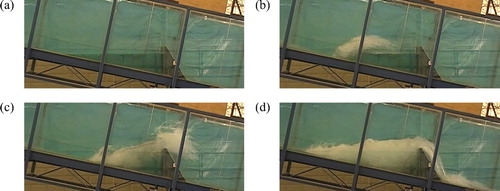
Figure 6 Snapshots of the overflow pattern
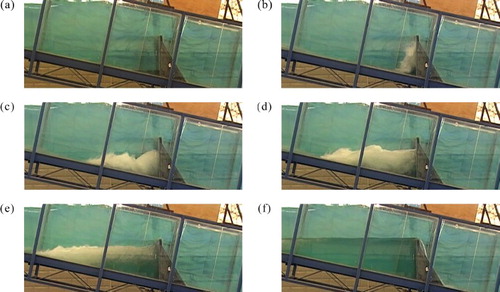
Figure 7 Time evolution of relative pressure loads for different cases: (a) intermediate dam removed (D = 0, hu = 0.20 m, hd = 0.30 m), (b) leap pattern (D = 0.40 m, hu = 0.20 m, h = 0.30 m, hd = 0.30 m), (c) overflow pattern (D = 0.60 m, hu = 0.20 m, h = 0.10 m, hd = 0.30 m)
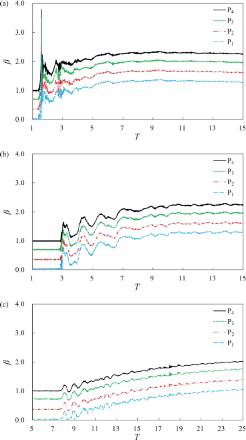
Figure 8 Relation of β and α for different water depths in front of the upstream and downstream dams: (a) hu = 0.15 m, hd = 0.10 m, (b) hu = 0.15 m, hd = 0.30 m, (c) hu = 0.30 m, hd = 0.10 m, (d) hu = 0.30 m, hd = 0.30 m (see Supplemental data)