Figures & data
Figure 1. Homogeneous fluid, vertical jet. Notation and control volume for momentum balance: (a) just after the impact, (b) jet completely formed
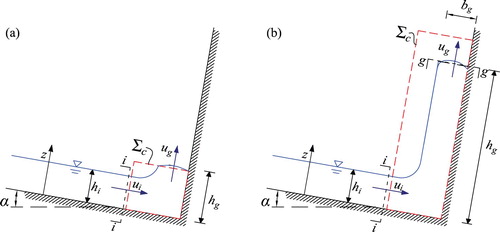
Figure 2. Experimental apparatus: (a) diagram of the experimental apparatus, (b) disposition layout of the five pressure transducers on the vertical wall, lengths in centimetres
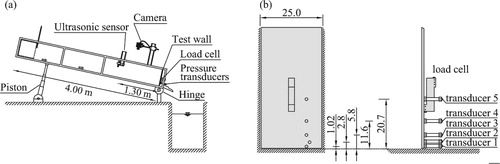
Figure 3. Flow depth evolution in time at a fixed position. Clear water: , Test W1-7
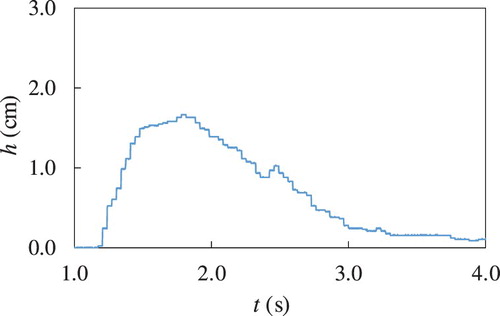
Figure 4. Sketch of the integration of the pressures. Mixture of water and sediments: C=0.4, , Test M-10
Figure 5. Example of a pressure and impact force evolution in time. Clear water: , Test W1-53; (a) pressures evolution in time at the five pressure transducers located at different heights along the wall, (b) evolution in time of the impact force, as measured directly by the load cell and indirectly by integrating the pressure transducer measurements
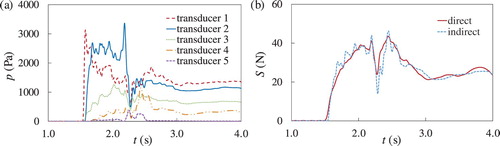
Figure 6. Dimensionless maximum impact force as a function of the Froude number for clear water and mixture of water and sediments. Comparison between experimental data and as calculated using momentum balance (Eq. Equation6): (a) clear water, (b) water and sediments for different values of solid concentration
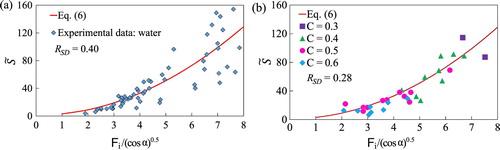
Figure 7. Dimensionless versus Froude number for clear water and mixture of water and sediments. Energy balance solution (Eq. Equation16
) against experimental data: (a) clear water, (b) water and sediments
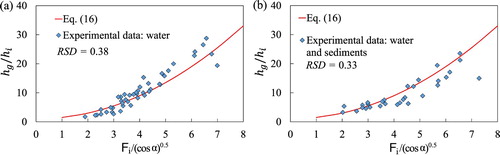
Figure 8. Impact time evolution. Clear water: , Test W1-50
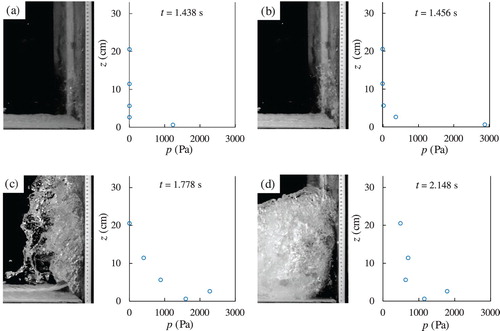
Figure 9. Impact time evolution. Mixture of water and sediment: , C=0.4, Test M-10
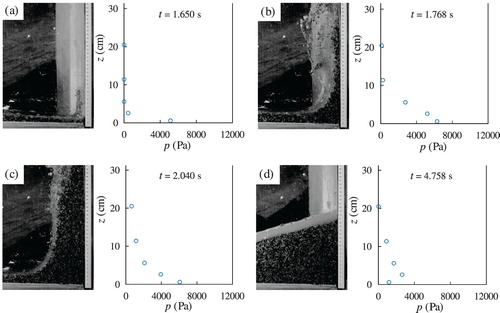
Figure 10. Jet curvature effect: pressure distribution along the vertical wall. Mixture of water and sediment: , C=0.4, Test M-10: (a) intrinsic coordinates system, (b) flow curvature of the jet
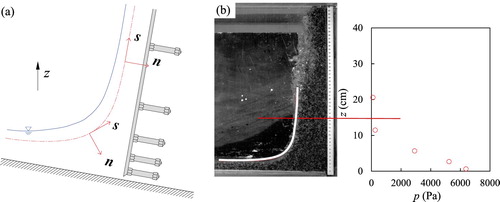
Figure 11. Clear water: comparison between experimental data and the momentum balance calculated for a reflected wave (Eq. Equation4) and for a vertical jet scheme (Eq. Equation6
)
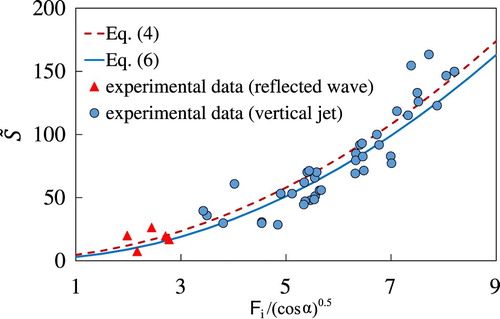
Figure 12. Example of the transversal pressures distribution. Mixture of water and sediment: , C=0.5, Test M-25
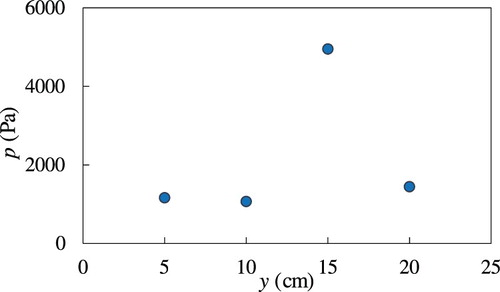
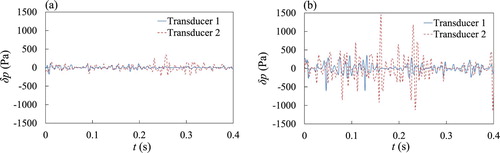
Figure 13. Example of the evolution in time of the fluctuating component of pressure on the wall, measured at the transducers 1 and 2 respectively: (a) clear water: , Test W2-30, (b) mixture of water and sediments:
, C=0.5, Test M-25