
Figures & data
Figure 1 Methodology for the identification of 1-D cavitation model parameters
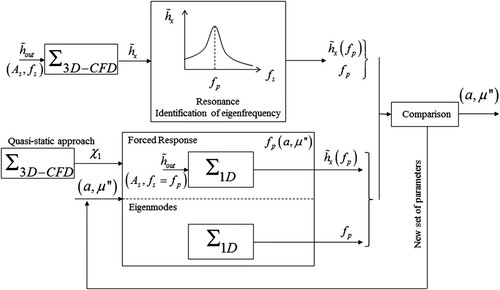
Figure 2 Schematic representation of the Venturi geometry (left) and meridian view of the Francis turbine (right)
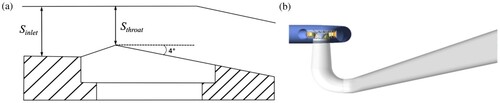
Figure 3 Experimental visualization of the cavitating vortex rope downstream the runner outlet
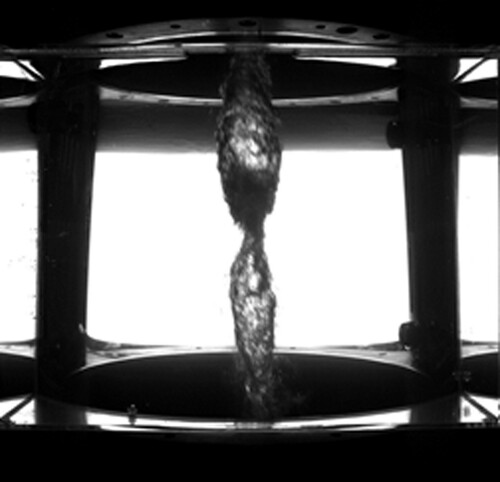
Table 1 Values of the parameters defining the operating point of the Francis turbine test case
Figure 4 Computational domain of the 2-D Venturi (a) and view of the mesh at the throat (b)
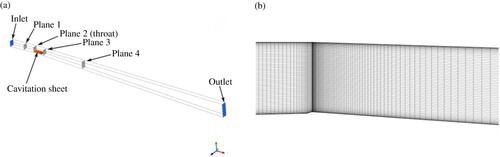
Figure 5 1-D transient models solved with the SIMSEN software. Venturi test case
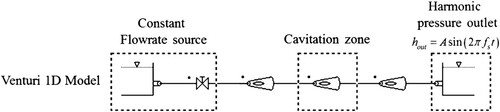
Figure 6 Contours of the liquid volume fraction (a) and the pressure (b) downstream the throat. 2-D Venturi test case. CFD results at the experimental boundary conditions
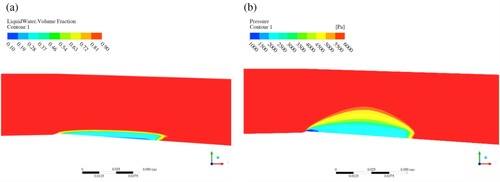
Figure 7 Evolution of the dimensionless cavitation volume versus the dimensionless discharge keeping the pressure at plane 3 constant. 2-D Venturi test case, CFD results
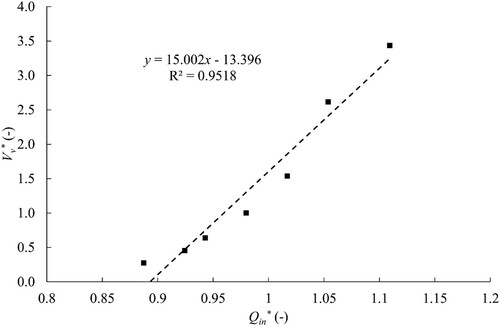
Figure 8 Time-history of the dimensionless piezometric head signal at the outlet and plane 3 for f = 0.5 Hz, f = 1.4 Hz and f = 2 Hz. 2-D Venturi test case, CFD results
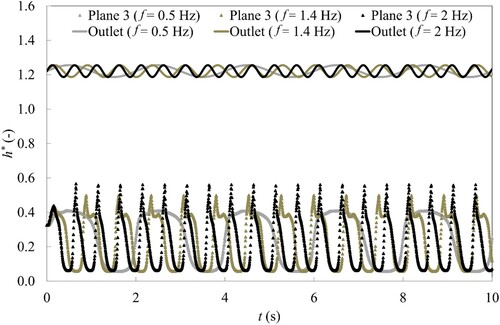
Figure 9 Time-history of the dimensionless piezometric head signal at the outlet and plane 3 for f = 4 Hz and f = 10 Hz. 2-D Venturi test case, CFD results
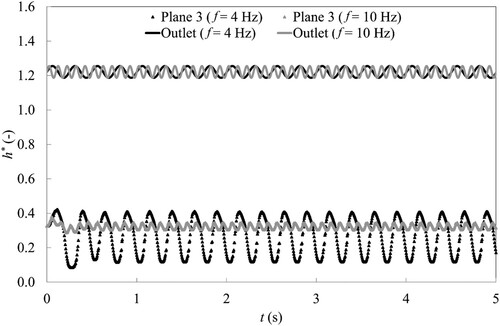
Figure 10 Time history of the dimensionless volume of vapour for f = 0.5 Hz, f = 1.4 Hz and f = 2 Hz. 2-D Venturi, CFD results
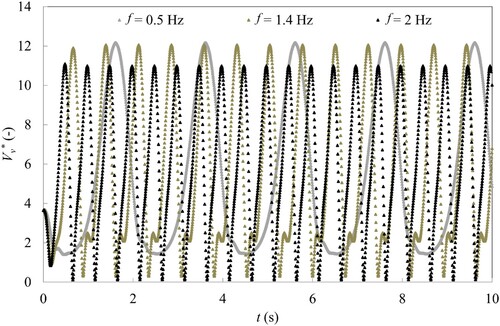
Figure 11 Time history of the dimensionless volume of vapour for f = 4 Hz and f = 10 Hz. 2-D Venturi, CFD results
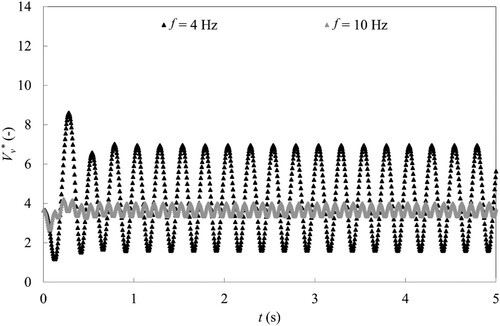
Figure 12 Forced response of the system for two different frequencies obtained with the 1-D transient simulation. 2-D Venturi test case. The circle point refers to the resonance condition for which the identification process has been carried out
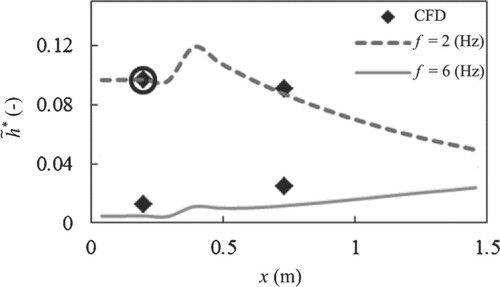
Figure 13 Computational domain of the 3-D Francis turbine (a) and associated mesh in a meridional plane (b)
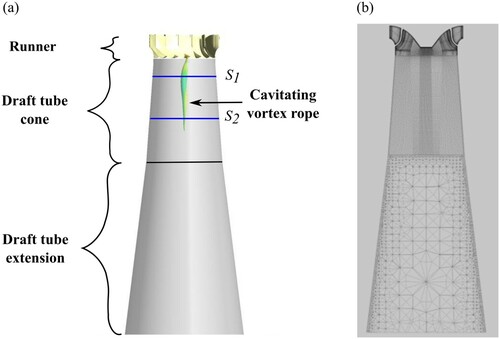
Figure 14 1-D transient models solved with the SIMSEN software. Francis turbine test case
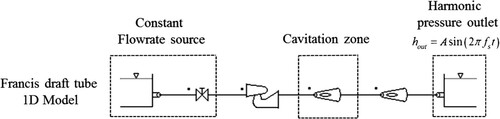
Table 2 Values of the σU parameter in the two sections of the draft tube
Figure 15 Evolution of the dimensionless cavitation volume versus the dimensionless discharge keeping the pressure at the domain interface constant. Francis turbine test case, CFD results
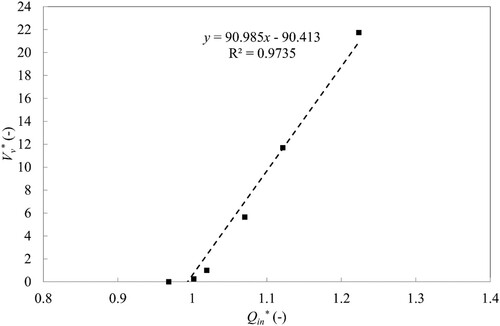
Figure 16 Time-history of the dimensionless piezometric head signal at the outlet. Francis turbine test case, CFD results
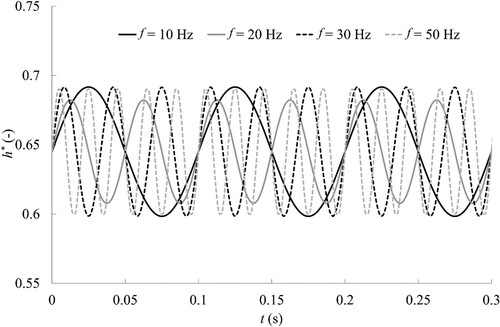
Figure 17 Time-history of the dimensionless piezometric head signal at the interface. Francis turbine, CFD results
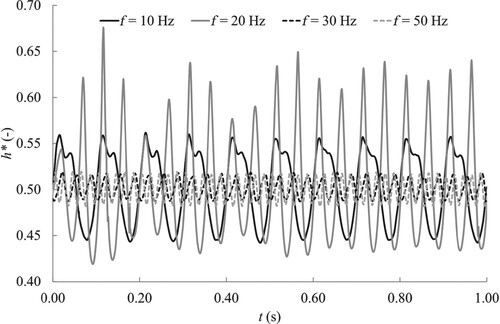
Figure 18 Time-history of the dimensionless volume of vapour. Francis turbine test case, CFD results
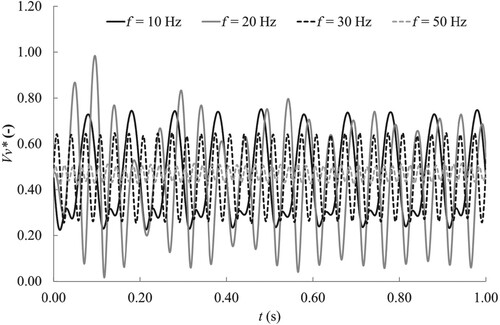
Figure 19 Forced response of the system for two different frequencies obtained with the 1-D transient simulations. Francis turbine test case. The circle point refers to the resonance condition for which the identification process has been carried out
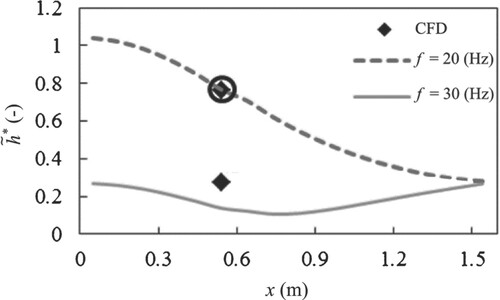
Table 3 Values of the identified parameter for both test cases