
Figures & data
Figure 1. (a) Experimental rig and (b) downstream section schematic. Photographs of (c) the downstream boundary condition and (d) high point.
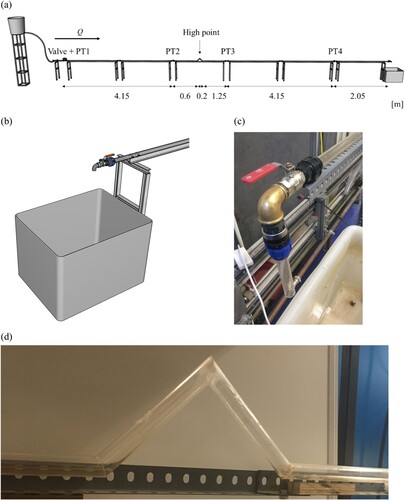
Figure 2. Test sample d = 3.0 mm and one high point pipe layout: (a) images at different pipe filling moments and (b) pressure-head signal at each pressure transducer.
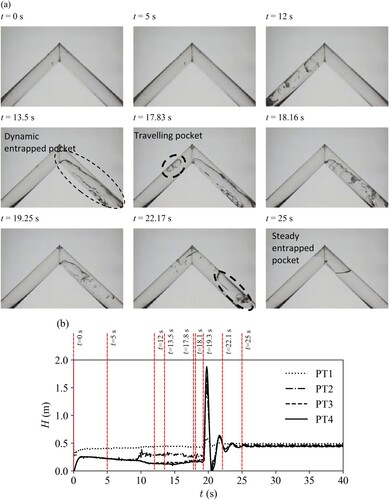
Figure 3. Distribution of the (a) maximum and (b) final steady-state flow rates during the pipe filling process for each downstream orifice size considering all tests; and (c) examples of flow rate time series and (d) corresponding head signal for each downstream orifice size.
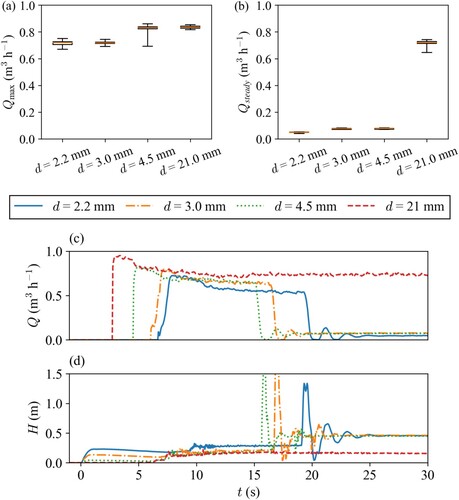
Figure 4. Example of image treatment: (a) original image with ROI and (b) detail of processed and binarized image.
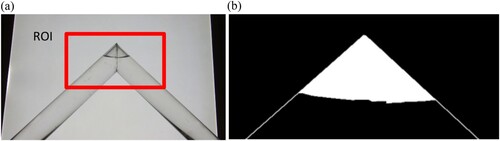
Figure 5. (a) Air pocket volume boxplots for each orifice size and (b) maximum and (c) minimum air pockets for d = 2.2 mm, across the repeated experiments.
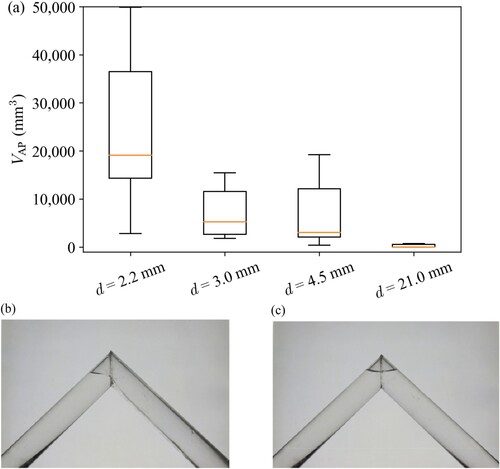
Figure 6. Normalized travelling air pocket volume for each downstream orifice.
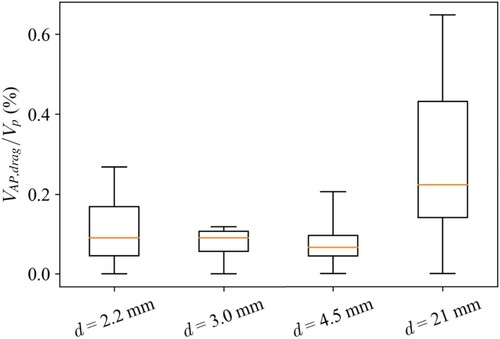
Figure 7. Flowchart of the proposed air pocket creation, transport and entrainment methodology.
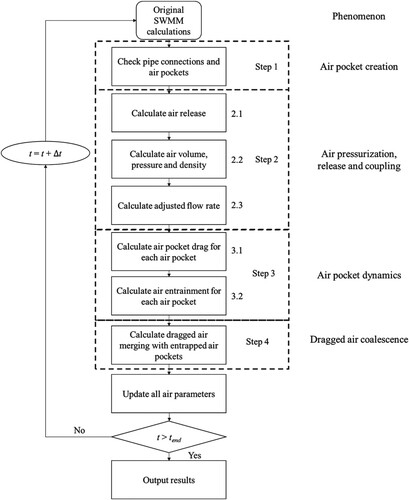
Figure 8. Air pocket creation conceptual representation: (a) pipe filling with free surface flow, (b) sudden pressurization of the pipe with an empty volume in the sloped pipe, (c) filled pipe with entrapped air pocket and (d) numerical implementation of entrapped air pockets.
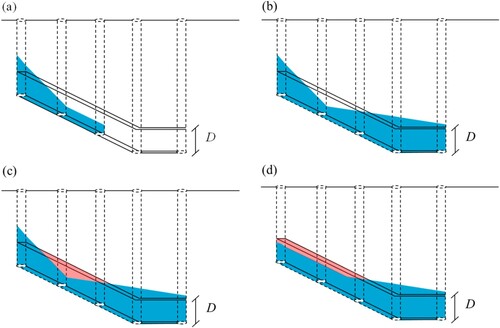
Figure 9. Initial air pocket volume for different normalized pipe lengths.
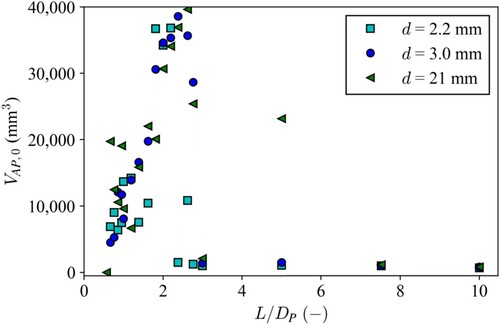
Figure 10. Experimental data and numerical results hydraulic head time series for d = 3.0 mm from the proposed methodology and Ferreira et al. (Citation2023) model at pressure transducers PT1, PT2 and PT3.
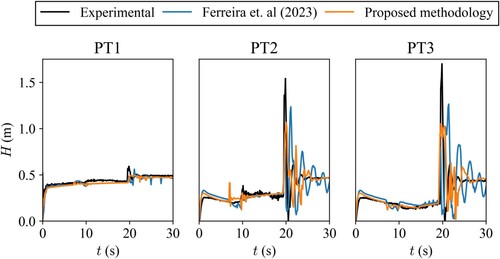
Figure 11. Calibration curves for maximum, average and minimum entrainment factors for d = 2.2, 3.0 and 21 mm cross section area ratios s/S.
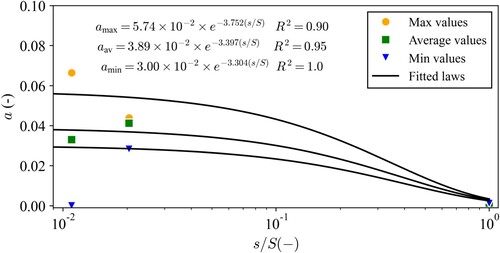
Figure 12. Comparison between experimental and predicted entrapped air pocket volumes for calibration and validation.
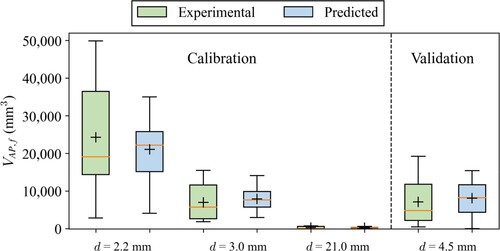
Table 1. Maximum, average and minimum experimental and numerical entrapped air pocket volumes and their respective errors for all orifice sizes.