Figures & data
Figure 1. Resilience of a group within trade unions and resilience of trade unions within a group.
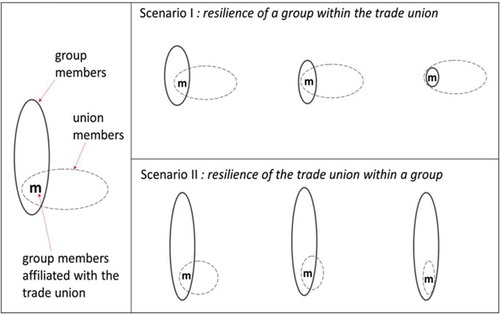
Table 1. Symbols and annotations used in the text.
Figure 2. Set theoretical view of trade union representation. See also
A: a set containing people belonging to a specific group; U: the set of all trade union members; W: the universal set containing the whole society; x: number of people belonging A but not affiliated with the trade union (see equation 2); y: number of trade union members who do not belong to A (see equation 3); z: number of trade union members who are belonging to A (see equation 1); r: number of people who neither belong to A nor affiliated with the trade union.
Figure 3. Changes in attractiveness of trade union representation — dotted line — as response to population changes: logic of exclusiveness. See also .
x: number of people belonging to a group A but not affiliated with the trade union (see equation 2); y: number of trade union members who do not belong to A (see equation 3); z: number of trade union members who are belonging to A (see equation 1); r: number of people who neither belong to A nor affiliated with the trade union.
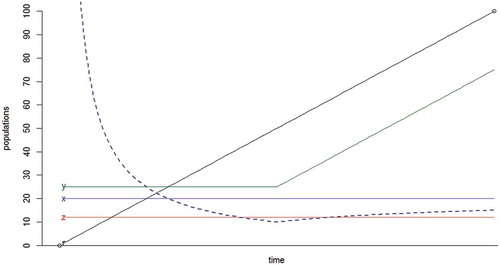
Figure 4. Visualization space.
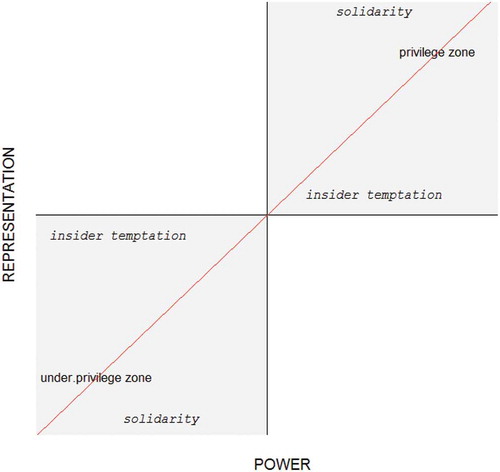
Figure 5. Gradual recruitment of trade union members from a single group. See also .
x: number of people belonging to a group A but not affiliated with the trade union (see equation 2); y: number of trade union members who do not belong to A (see equation 3); z: number of trade union members who are belonging to A (see equation 1); r: number of people who neither belong to A nor affiliated with the trade union.
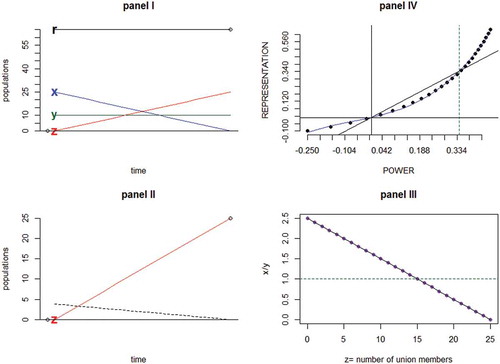
Figure 6. Four basic indicators of the model. See also .
x: number of people belonging to the designated educational group but not affiliated with trade unions (see equation 2); y: number of trade union members who do not belong to the designated educational group (see equation 3); z: number of trade union members who are belonging to the designated educational group (see equation 1); r: number of people who neither belong to the designated educational group nor affiliated with trade unions.
Figure 7. Privilege condition (β) and union membership (z). See also , and Equations 1 and 28.
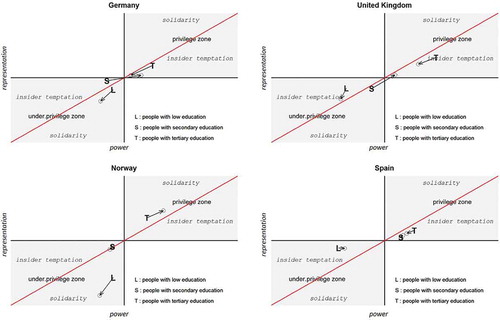
Figure 8. Movement of the attitude indicator (α) across groups and countries. See also and Equation 25.
Figure 9. Movements of educational groups in the visualization space.