Figures & data
Table 1. Model specification in the baseline scenario.
Table 2. Simulation design.
Table 3. Average degree and gross segregation (log-transformed) of Mutual support expectations networks in simulation scenarios. Mean values were averaged over 1,000 realizations, standard deviation are reported in parentheses.
Figure 1. Boxplots of average degree and gross segregation across simulation scenarios (1,000 realizations each). Bold horizontal lines indicate median values, red dots indicate mean values.
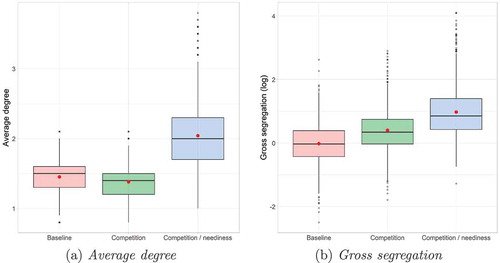
Figure 2. Simulated dynamics of average outdegree of Collaboration, Trust, and Support expectations networks. (Values averaged over 100 replications).
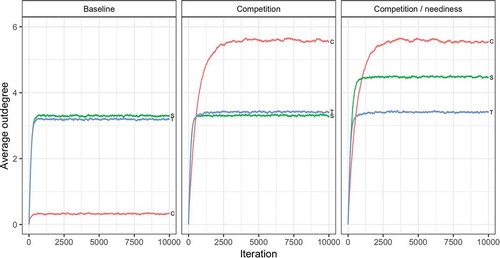
Figure 3. Simulated dynamics of average outdegree of Collaboration and Support expectations within and between resource classes across scenarios. (Values are averaged over 100 replications).
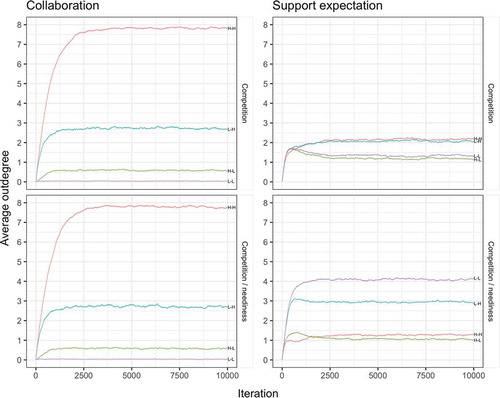
Figure 4. Instances of simulated Mutual support expectation networks across scenarios. Node colors represent resource classes. Green: -agents; red:
-agents.. In the Printed version Black: L-agents; white: H-agents
Figure A1. Average degree of Mutual support expectations across scenarios for 20, 50, and 100. (Mean values over 1,000 realizations).
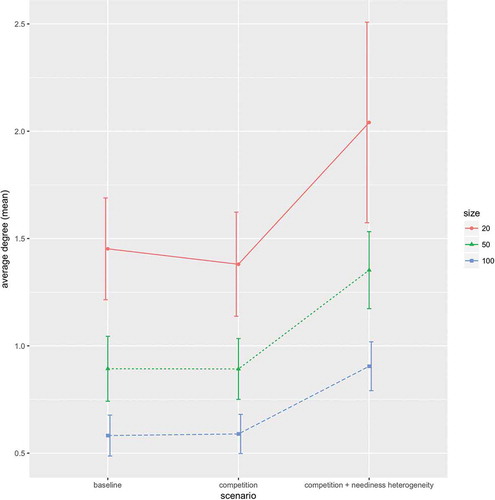
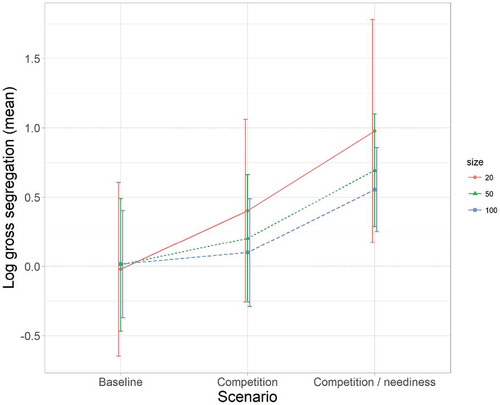
Figure A2. Gross segregation (log) of Mutual support expectations across scenarios for 20, 50, and 100. (Mean values over 1,000 realizations).