
Figures & data
Figure 1. Node net of the main campus in Neuherberg. Red crosses on the ground plan display node points to create a node distance net between all buildings on the campus. Letters on the crosses (e.g. a or b) represent several entrance doors of one building.
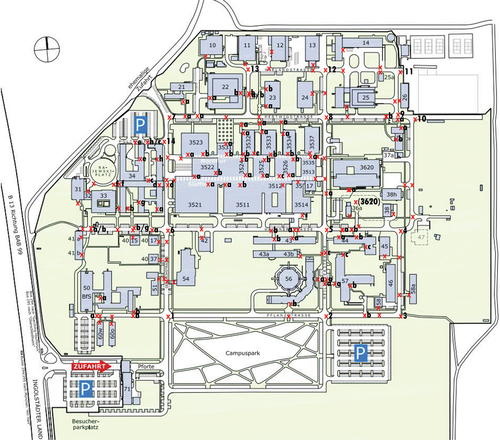
Table 1. Summary of employed publication data (from 2015 to 2019) after filtering as described in the main text.
Figure 2. Exemplary author collaboration network. Node size can represent e.g. the node degree; edge thickness or color is used to display further information, e.g. darker color for smaller and brighter color for larger distance between two authors.
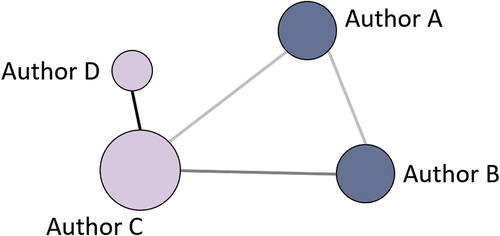
Figure 3. Example of QAP permutation scheme with a random simultaneous row/column permutation. In a symmetric matrix with identical row/column names, row names are reordered randomly and the same order is used for column ordering.
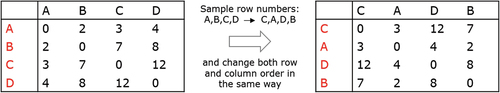
Figure 4. Empirical cumulative distribution functions (eCDFs) of distances between author pairs. Blue: Distances between authors with joint publications; for multiple publications, the distance is considered only once. Grey: Distances between all author pairs, also those without joint publications. A: All author pairs for the Neuherberg campus at Helmholtz Munich; ,
. B: Interdisciplinary author pairs, i.e. two authors coming from different institutes, for the Neuherberg campus at Helmholtz Munich;
,
. C: All author pairs for Bielefeld University;
,
. D: Interdisciplinary author pairs for Bielefeld University;
,
. For each panel, the two-sided Kolmogorov–Smirnov test yields p-values less than
regarding the null hypothesis that the two eCDFs arise from the same distribution.
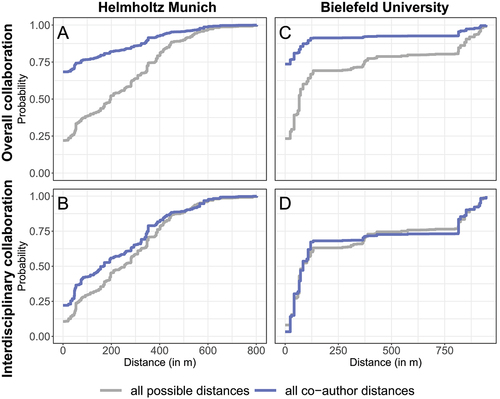
Figure 5. Institute networks for Helmholtz Munich (left) and Bielefeld University (right). The node size is proportional to the number of collaborative publications per institute. Connectivity between all institutes is apparent, as also reflected by the mean degree of 20.77 (Helmholtz Munich) and 7.75 (Bielefeld University). Colors correspond to research categories as in Figure A1 (Helmholtz Munich), and to institutes as in Figure A2 (Bielefeld University).
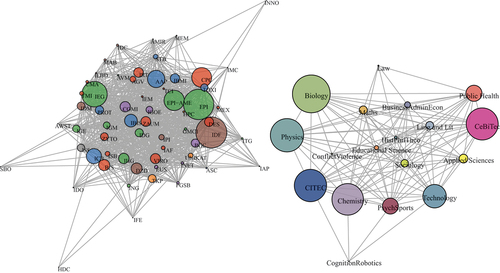
Figure 6. Helmholtz Munich: empirical density functions of estimated model coefficients across the QAP permutations. The estimated coefficients based on the non-permuted data are indicated by the dashed line.
Figure 7. Bielefeld University, main building: density functions as described in Figure 6.
Figure 8. Bielefeld University, overall campus: density functions as described in Figure 6.
Table 2. Helmholtz Munich: estimated hurdle-QAP model coefficients and according QAP p-values. Effects with significant QAP p-values are marked with .
and
represent the coefficients from the binomial and the ZTP model for the distance variable,
and
for the variable of publication strength.
Table 3. Bielefeld University, main building: estimated hurdle-QAP coefficients as described in .
Table 4. Bielefeld University, overall campus: estimated hurdle-QAP coefficients as described in .
Figure 9. Helmholtz Munich: The first two columns show the predicted response (column one: collaboration probability; column two: expected number of publications) in the non-parametric model as a function of distance. Thick red lines show the predicted response based on the original non-permuted data. Thin grey lines result from QAP-permuted data (). The red-shaded area indicates the confidence
interval of the original predicted response. The bold blue lines represent the lower and upper bounds of the pointwise
-confidence bands (shaded areas in light blue) over the permuted estimates. Effect curves are displayed on the predicted response scale (probability of collaboration for the binomial and expected number of publications for the ZTP part) keeping the covariate of publication strength at its mean value. Values of observed distances are shown as black ticks on the x-axis to visualise the sparsity of the data basis. The dotted line represents the predicted response of the parametric model with linear effect. The third and fourth column display the parametric hurdle-QAP estimates for the effect of publication strengths as described in Figure 6.
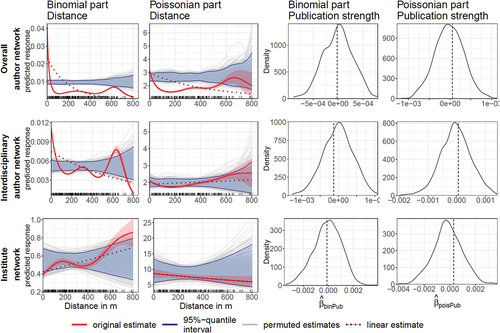
Figure 10. Bielefeld University, main building: Non-parametric hurdle-QAP estimates as described in Figure 9.
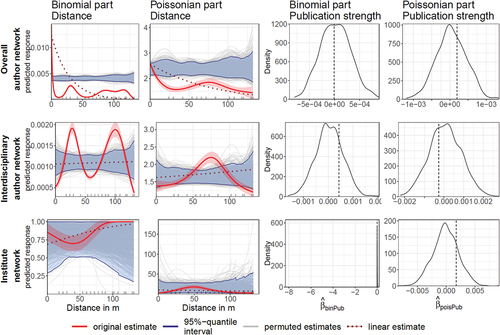
Figure 11. Bielefeld University, overall campus: Non-parametric hurdle-QAP estimates as described in Figure 9.
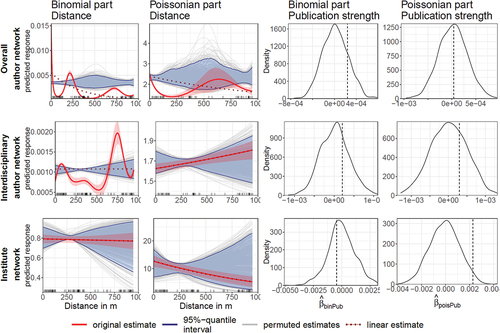
Table 5. Helmholtz Munich: effective degrees of freedom (edf) of non-parametric spline functions and estimated coefficients as described in Table 2. edf indicate how wiggly a curve is. Values of one or close to it describe an (almost) linear effect. The higher the value, the wigglier the curve.
Table 6. Bielefeld University, main building: edf of non-parametric spline functions and estimated coefficients as described in .
Table 7. Bielefeld University, overall campus: edf of non-parametric spline functions and estimated coefficients as described in .