
Figures & data
Table 1. Modelling decisions in selected social network learning literature.
Figure 1. (a) the single agent learner model illustrated conceptually and (b) two example paths of the model dynamics in the random walk interpretation. denoting the Bernoulli distribution with parameter
.
Table 2. Sample paths and agent beliefs as random walks.
Figure 2. The probability of a single agent quitting plotted against
for different values of
while
and
. Analytical results are plotted as lines, while simulated results (4 000 iterations) are shown as points with 95% confidence intervals.
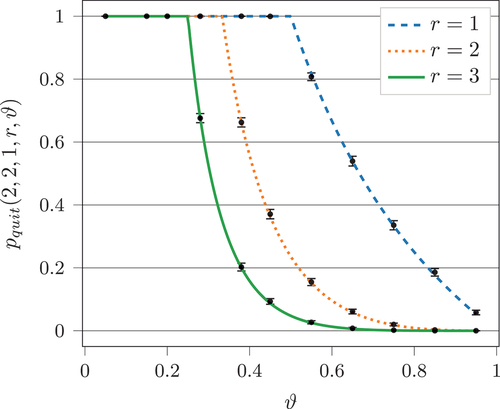
Figure 3. Expected time in the system conditioned on the agent quitting at some plotted against
for different values of
while
and
on a log-linear axis. Analytical results are plotted as lines, while simulated results are shown as points with 95% confidence intervals.
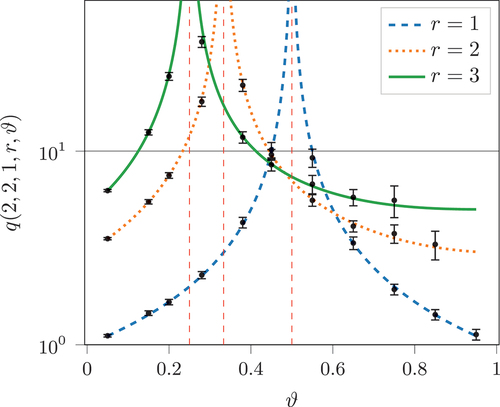
Figure 4. The probability of a single agent quitting plotted against for different values of
while
and
. Analytical results are plotted as lines, while simulated results (4 000 iterations) are shown as points with 95% confidence intervals.
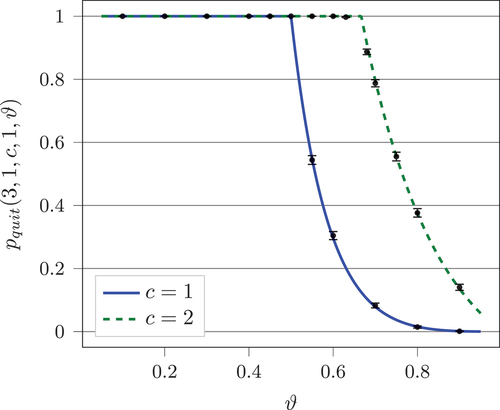
Figure 5. Expected time in the system conditioned on the agent quitting at some plotted against
for different values of
while
and
. Analytical results are plotted as lines, while simulated results are shown as points with 95% confidence intervals.
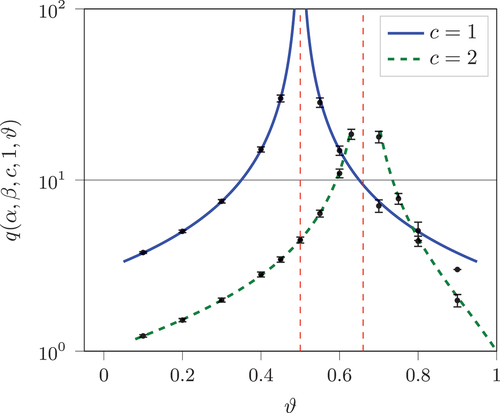
Figure 6. The observable rewards model of learning.
Figure 7. The observable actions model of learning.
Figure 8. An illustration of the weighting used in the interpretation of the observed action.
Figure 9. The random walk interpretation of the or model as well the individual sample paths of the respective agents.
Table 3. Estimates, in the respective models.
Figure 10. Simulation results for in the
case.
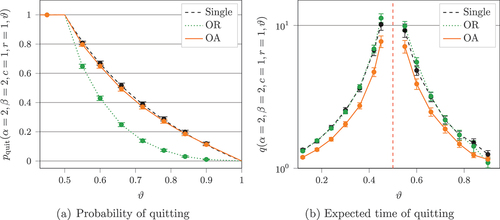
Figure 11. Simulation results for in the
case.
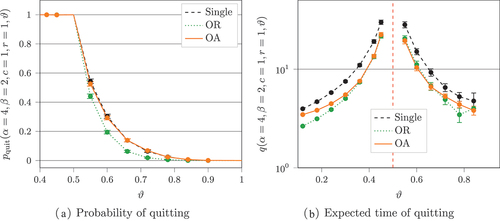
Figure 12. Simulation results for and
in the
case.
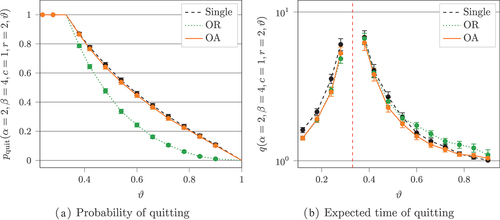
Figure 13. Simulation results for and
in the
case.
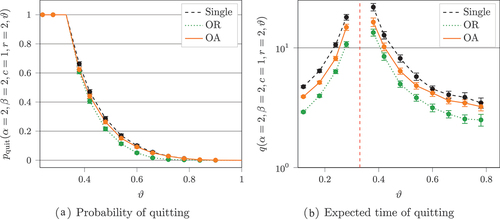
Figure 14. Simulation results for and
in the
case.
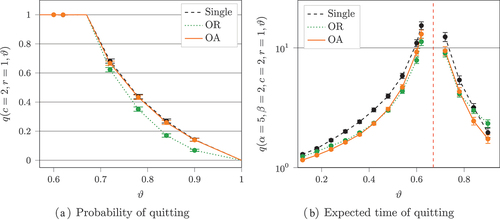
Figure 15. Simulation results for and
in the
case.
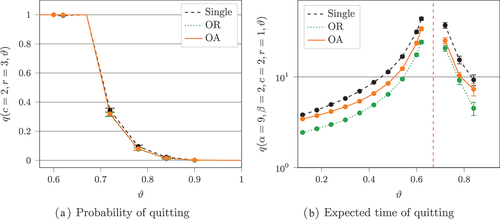
Figure 16. The results of extra simulation runs for the probability of quitting. In these runs ,
, and
.
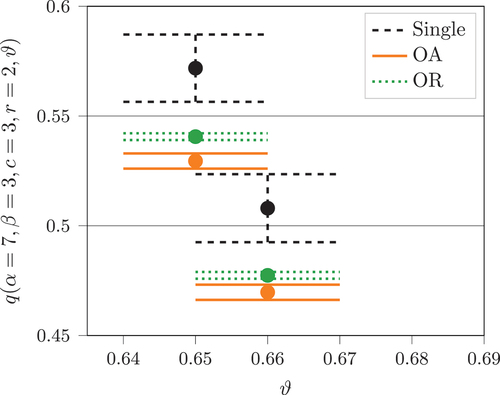
Table 4. Two random walks.
Table 5. Probability of quitting and the expected time to quitting in the single agent model (Sol), the observable actions model (OA) and the observable rewards model (OR). Parameters and
set such that
Table 6. Probability of quitting and the expected time to quitting in the single agent model (Sol), the observable actions model (OA) and the observable rewards model (OR). Parameters and
set such that
Table 7. Probability of quitting and expected time to quit in the single agent model (Sol), the observable actions model (OA) and the observable rewards model (OR). Parameters and
set such that